Volume Weighted MA (VWMA) Indicator
The Volume Weighted MA (VWMA) represents a combination with moving averages and volume information. It functions in the same way as a standard moving average. Its only difference is that it provides more weight to bars with high trading volume compared to bars with less trading activity.
The Volume Weighted Moving Average is applicable to any type of time frame in MT4. Advanced traders employ the VWMA using multiple time frames to provide an accurate assessment of market sentiment.
The VWMA is a flexible and adaptable trend following indicator. In addition to beginners, experienced professionals can find this MT4 indicator simple and helpful in studying market trends. In addition, the Volume Weighted Moving Average can be used as a dynamic level of price support or resistance.
How do I trade with the Volume Weighted MA indicator in MT4?
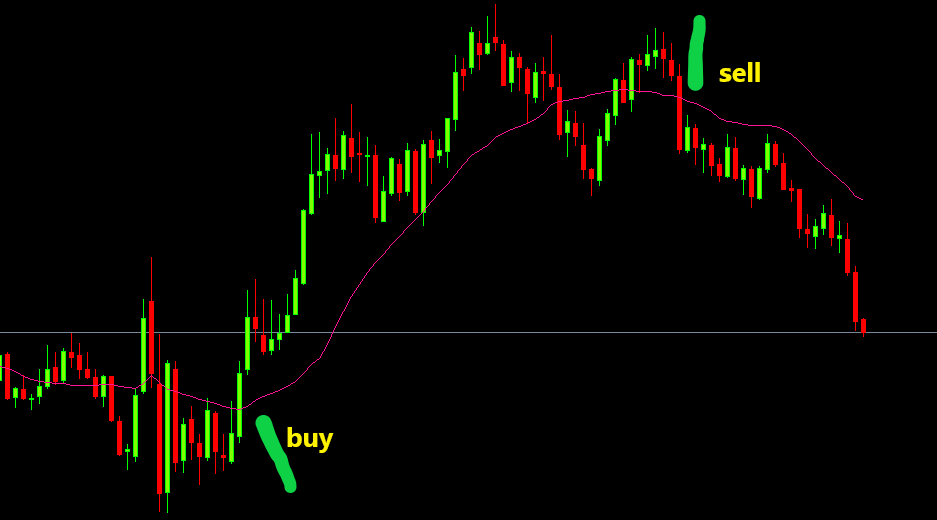
Once you have downloaded and installed the Volume Weighted Average indicator on your MT4 platform, your chart will look similar to the one above. This appears to be a normal moving average. If you are fairly familiar with SMA and EMA and VWMA, you will find that VWMA is very easy to trade.
For a sell order, first the price must fall below the level of the volume weighted average. In the next step, this VWMA line needs to be interpreted as resistance each time price returns to the level of the indicator.
Many traders are using the Volume Weighted Average as the level at which the price breaks through. This means that each time price crosses the VWMA threshold it is considered an opportunity to trade a breakout.
The indicator is used to react a little differently than a normal moving average. Generally, moving averages react based on the opening, lowest and closing price of each price candle. In reality, the VWMA only selects the most traded candles to determine the value of the asset’s moving average.
We determine the market trend by analyzing the relationship between prices and VWMA values. When the price of the trend is higher than the value of the indicator. On the other hand, when the price is below the VWMA value, we see that the market trend is bearish.
If you can identify the market trend in the right way, you can apply various price action strategies to initiate orders in the direction of the trend. For example, in an uptrending market, you can place a buy order when the price is in line with the slope of the VWMA.
Conclusion
This is one of the Volume Weighted Averages and is a multi-purpose moving average indicator. In addition to identifying market trends, it reveals possible levels of trade entry. In addition, you can use the VWMA line as the primary stop-loss level for your current order.


Responses