Visualize MACD Indicator Download
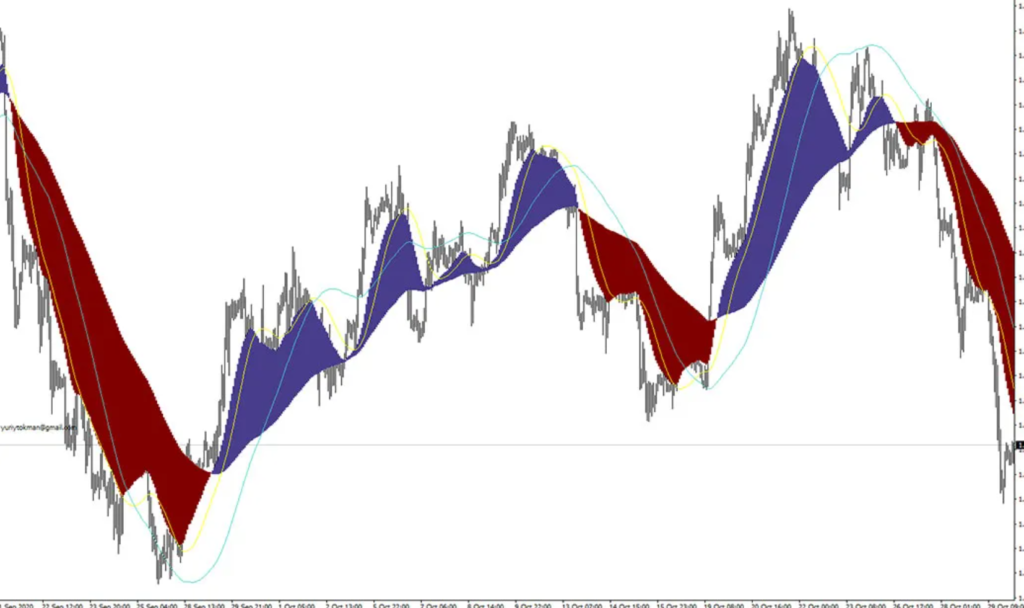
The Visual MACD indicator is a forex technical analysis tool based on moving average convergence dispersion, but it is plotted directly on the main trading chart.
It is a short-term trend following indicator.
When the MACD wave is blue, you should look for buy trades. Likewise, when the MACD wave is red, you should look for a sell trade.
We recommend using this as an open and exit trade filter. Go ahead and add it to your best trading system.
It is suitable for various time frames and currency pairs.
The default indicator settings can be modified directly from the input tab. Feel free to experiment with the settings and parameters to suit your personal preferences.
[sociallocker id=24390]visual-macd.rar[/sociallocker]

Responses