Volume Profile Indicator

The volume distribution indicator is an important aspect that many forex traders often overlook in their analysis techniques. Because trading activity characterized by increased volume is usually associated with price reversals, traders in the forex market consider these aspects to be critical. mt4’s Volume Curve Indicator provides forex traders with low volume, high volume, and controlled volume.
How does indicator work?
The volume profile can come in any shape depending on the distribution of volumes. It draws by using horizontal lines to form a histogram. The more the volume trades at a given level, the bigger the profile becomes.
The volume profile is usually located at the right side of the chart beside the price levels. Bars represent it. The volume profile bars are created by getting total volume traded at a price, in a given time. The total buy is then divided, and volumes sold representing it on a histogram chart. Traders can understand and use the volume profile indicator as one of the important tools among all their technical analysis tools.
Volume Distribution Indicator Trading Opportunities
This is because the indicator shows volume levels to build an image of volume. Thus, it helps Forex traders to identify potential reversal areas. In addition, it is the point of volume control, VPOC and POC, that proves to be a good support or resistance area as a reversal point.
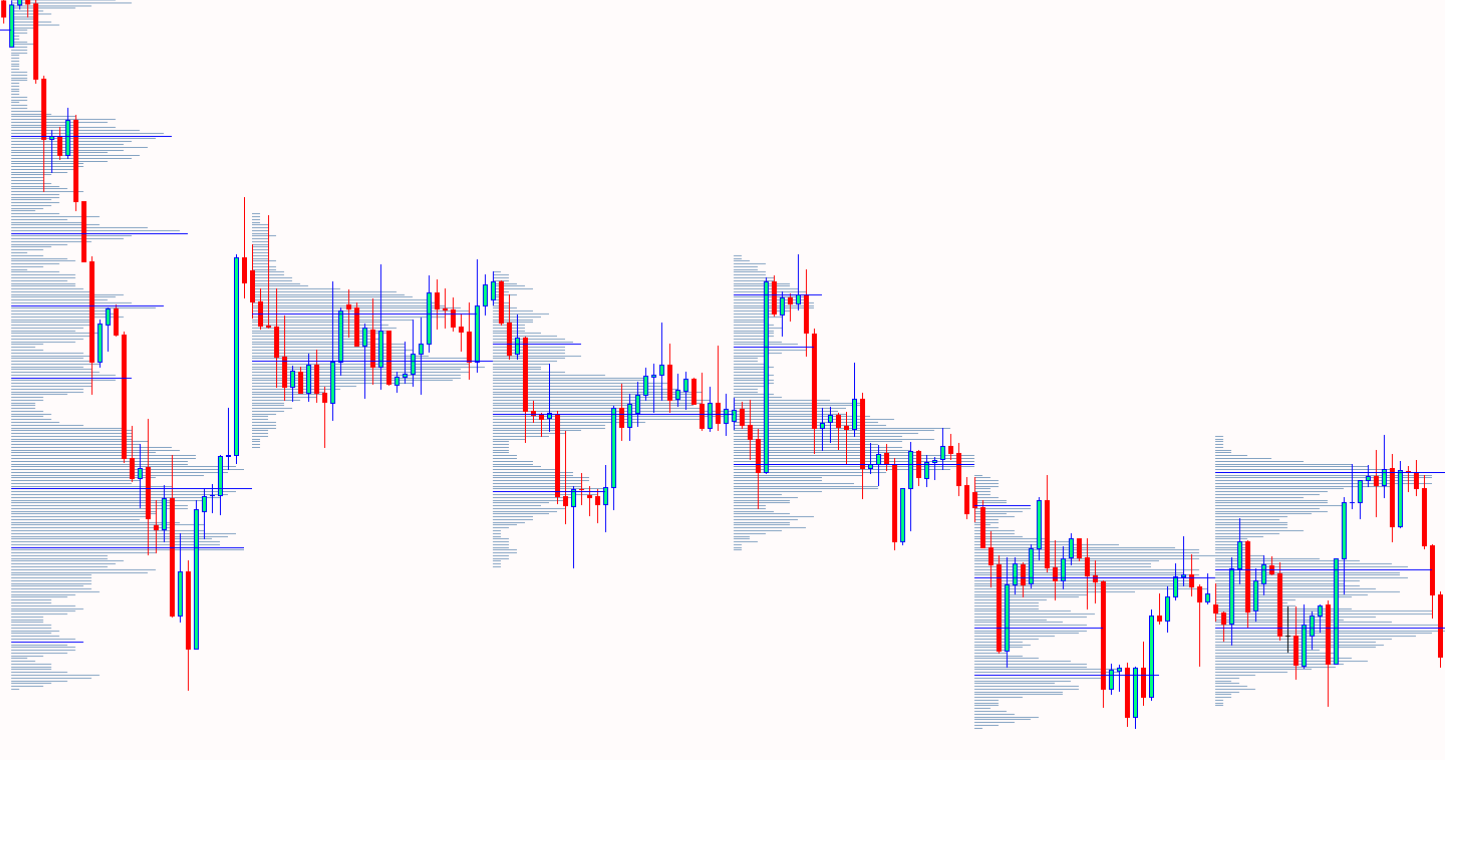
When VPOC or POC areas are identified as such, they are potential support points as well as resistance points, and the market will often test them again. In turn, retesting in these areas provides additional entry opportunities. In addition, as a VPOC, volume control points can be a good exit point to record profits. Along with the VPOC, areas with a lot of volume can also be an exit point.
Traders often use the VPOC in conjunction with the TPO (Time Price Opportunity) to form a complete market profile. Because the Volume Curve indicator provides visual lines and bars, it is useful for any type of online forex trader. In addition, this indicator is completely free to download and can be used on any time frame chart. However, forex traders must use price behavior to verify the indicator’s signals in order to obtain the most favorable trading results.
What Is Volume Profile Indicator?
Volume Profile indicator (also called Market Profile in some cases) is a handy tool for checking price action on a chart.
One of the first thing that traders mark up when analyzing a chart is support and resistance. Volume Profile can be used for doing that too.
Not only Volume Profile allows you to spot support and resistance levels, it also highlights prices where there was heavy price action in the past.
Knowing that some prices had important activity in the past can significantly help setting up trades, stop-losses, and take-profits for your future trades.
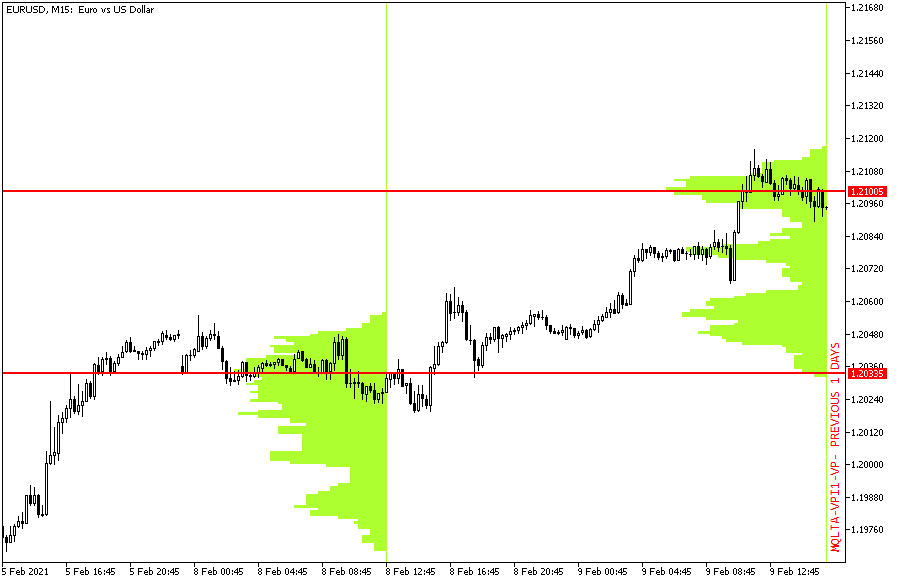
The indicator scans the defined number of previous bars and calculates the volume of activity at each price level.
The result is presented through a vertical histogram chart — the longer the histogram is, the more activity at that price level was.
You can set the indicator to display the volume profile up either to the current, most recent candle, or to some previous date.
Conclusion
Volume profile is a very valuable analysis tool. Lots of traders use it everywhere they can. Volume profile has been continually relevant as a result of its versatility. It is a charting tool that has a wide usage capability.
The volume Profile provides trader with accurate data. It is more of a reactive tool for discovering traditional and resistance areas and so traders are still developing indicators which would be more proactive and predictive in nature.
- With every other indicator, only two variable let traders do the calculations. They are: Price and Time but with volume profile indicator, there are three variables available. These variables are: Price, Time, and Volume.
Most standard trading indicators only show how the price is moving in the past. The main notable difference between those numerous indicators is how they visualize it. That made them less efficient and makes traders to keeping moving from one indicator to the other.


Responses