Mass Index Indicator
Identifying trends that are reversing in advance is a great way to create profitable trades in the Forex market. This Mass Index indicator is one of the few indicators in the field that can effectively detect and provide alerts for trend reversals.
The Mass Index indicator helps traders spot trends that are reversing by looking at the speed and strength of the currency pair.
Trend changes, also known as reversal bumps, are identified when the indicator goes above the 27 mark and then drops below 26.5.
When the indicator detects a trend bump, traders can take long or short term trades, or open positions.
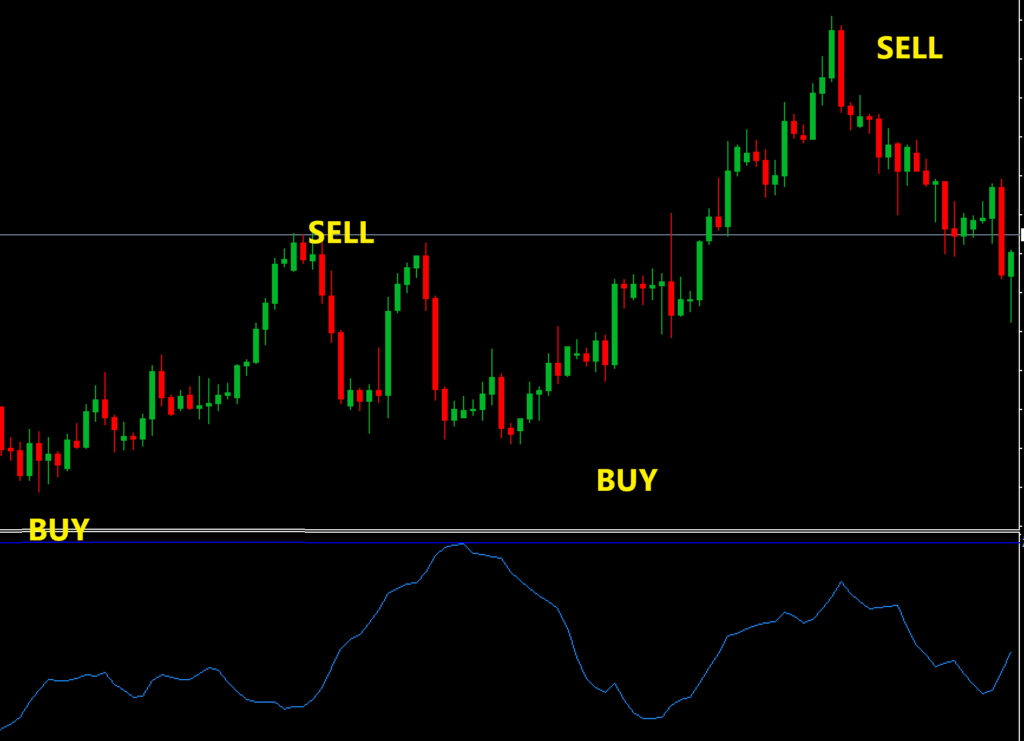
In the above chart, the two important points on this indicator (26.5 as well as 27) are clearly marked by purple lines for easy identification.
How to use the Mass Index indicator

When a reversal-like rumble is observed in the Mass Index indicator, traders should look for a potential trend reversal.
If reversal patterns are noted, such as bullish engulfing bearish engulfing or pin bar and doji candlesticks, short or long trades can be made.
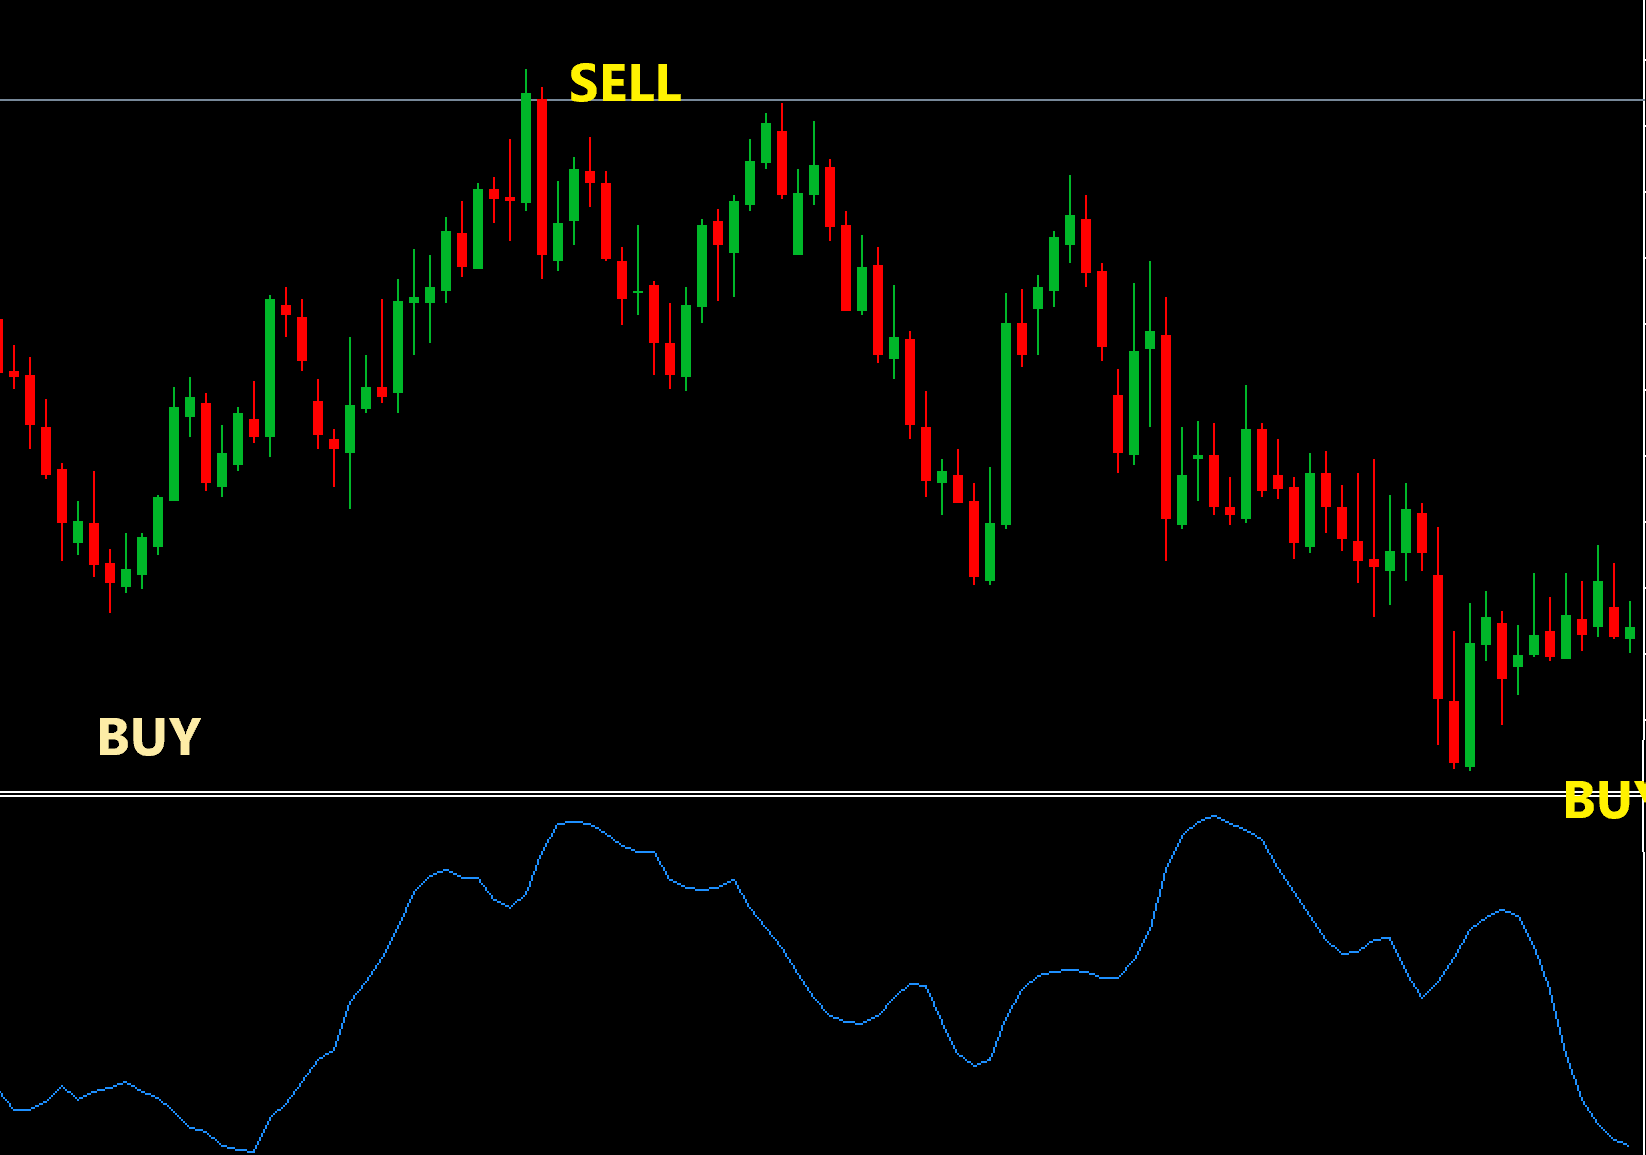
The chart shows how to execute short-term trades by using the Mass Index indicator.
When an engulfing bearish candle is observed on the chart, indicating the end of an uptrend and the beginning of a downtrend, a sell-off (represented by a downward movement in this chart) is executed.
Stop Losses can be placed at the top of the band
Trailing stops can be used in markets that are trending to trade, where you can take a trailing stop and ride the developing trend.
This indicator can be applied to any time frame, however, it is best to use more time sensitive frames (daily monthly, weekly and daily charts).
Conclusion
The Mass Index indicator is one of the most reliable indicators for detecting reversal trends. It can be used in any time frame and is easy to understand. the Mass Index indicator can be used alone, but it will give the most effective results when used together with price behavior and other technical indicators such as moving average crossovers and MACD.
[signinlocker]
mass-index.EX4
[/signinlocker]


Responses