Heiken Ashi Indicator
Japanese candlestick charts, among the three charting methods used in Forex, are the best known and most frequently used charts for analyzing technical aspects. The candlestick chart shows the opening, high, low and closing price of each bar and it also shows whether the candle is bearish or bullish. Although this chart is one of the most commonly used charts, it is prone to false signals due to the amount of noise present in the market. Problems with Japanese candlesticks can be corrected with the Heiken Ashi indicator.

The indicator is a special Japanese candlestick chart that takes the average of two periods, making it smoother than a standard candlestick.
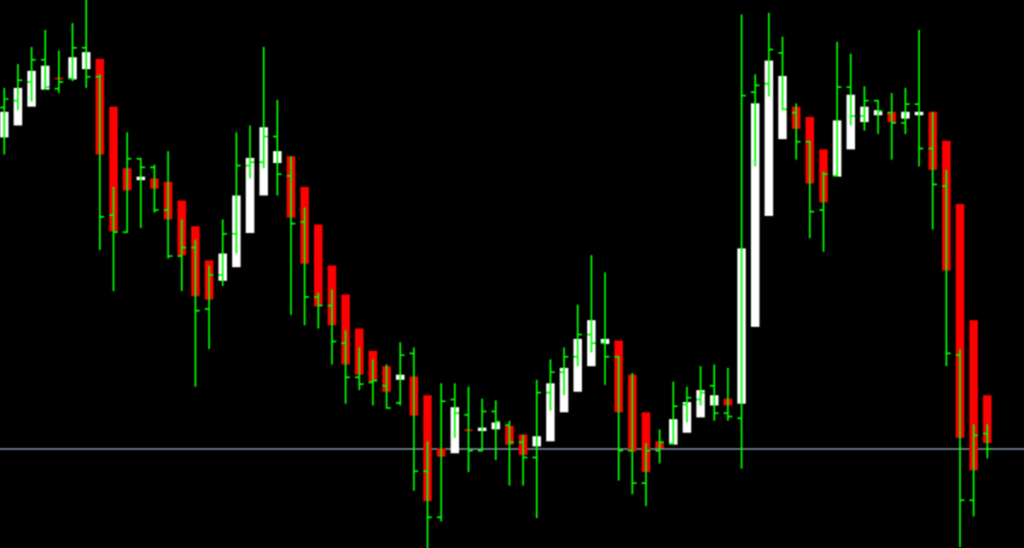
In the two charts above In the two charts above, you can see that typical Japanese candlesticks often change from green to red, which can make them difficult to understand.
On the other hand, the candles on the Candlestick Heiken Ashi chart are more uniform in color, staying red in an uptrend and green in an uptrend.
It is easier to identify trends and trend reversals as this indicator helps to smooth the chart and eliminate market noise.
Finding trends as well as reversals with this indicator allows traders to determine if they should hold open positions or leave the market.
This Heiken Ashi indicator is specifically designed for long-term trend riding and also for exiting the market when the trend turns weak.
How to use the Heiken Ashi indicator

Traders in the technical markets use this Heiken Ashi indicator to spot trends.
The red candles on the Heiken Ashi indicator mean that the trend is towards the downside. However, the green candle means that the trend is upward, as shown in the chart below.
The wick of the indicator candle can be used to determine the strength of the trend.
In an uptrend, a bullish candle without a lower wick is an indication of the strength of an uptrend.
Also, a bearish candle without an upper wick in a downtrend indicates the strength of a downtrend.
If your Heiken Ashi indicator candle changes from red to green, it indicates that there is a downtrend forming. Long trades must be closed, while short trades are opened.
Therefore, when the indicator candle turns from green to red, this signals that there is an uptrend forming. Short trades should be stopped and long trades should be avoided.
You can also use the weekday indicator candles, which are used in the same way as the standard Japanese candlesticks, for stopping reversal signals, such as doji, spinning tops.
Summary
The Heiken Ashi indicator is the best choice for spotting and navigating the duration of an uptrend. Because of this, it is the best indicator for traders who trade in trends.
In addition, the indicator helps to reduce false signals when trading in choppy or sideways markets and assists traders in not participating when the market is in such a state.
The reaction time of these candles is slow, which is why it is not suitable for scalpers as well as day traders.
This indicator is ideal for trading volatility and position trading and can follow trends over a long period of time.
[signinlocker]Heiken-Ashi.zip[/signinlocker]

Responses