Fractal Support and Resistance Indicator
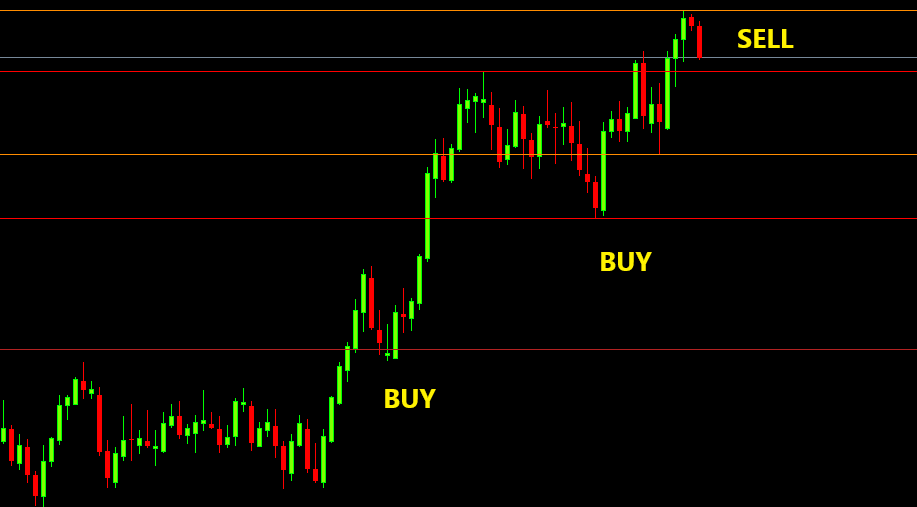
It is Fractal Support and Resistance is an automated horizontal indicator based on the resistance and support of MetaTrader 4. The fractal lines indicate strong support and resistance zones and help Forex traders identify breakouts and volatile trading opportunities.
The indicator can be used as a good alternative to the Pivot indicator. Pivot lines are drawn based on price at the high, low and close. Conversely, fractal points are calculated based on higher lows and higher highs of the price.
Typically, fractal indicators are often plotted with arrows that signal a potential trend reversal. If you manually connect straight lines, then you can see dynamic and horizontal price channels. The main benefit of the support and resistance fractal is that it connects the fractal points to form a vertical price channel.
How can I trade with this fractal strength as well as resistance MetaTrader indicator?
The chart demonstrates the efficiency of the automated fractal channel in showing solid resistance and support levels.
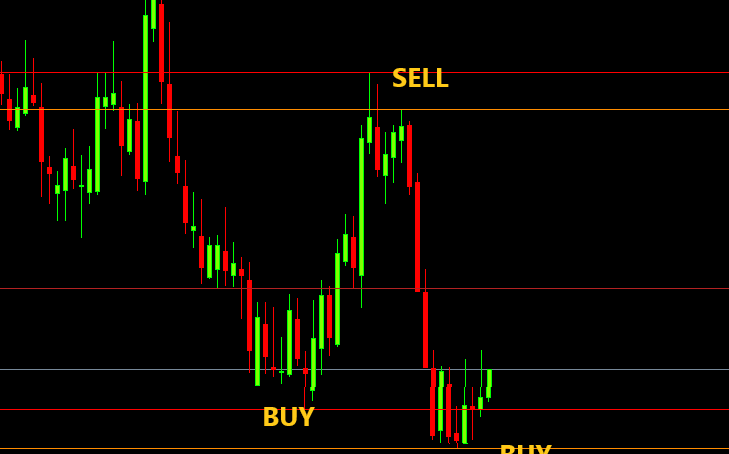
The dotted fractal lines are the S/R levels of the week. However these thick lines indicate the key intra-day event zones that price is in. In the chart above, as you will see, price is most likely to move within the channel of the fractal. This is because the horizontal lines of the channel are key event zones Price usually bounces after the S/R zone.
If you are going to open an intraday chart, you should first look at the location of the resistance and support lines. Also, note where the price is when compared to the level of the fractal. For example, if the price drops below the level of the fractal resistance line, it indicates that you should look for opportunities to sell.
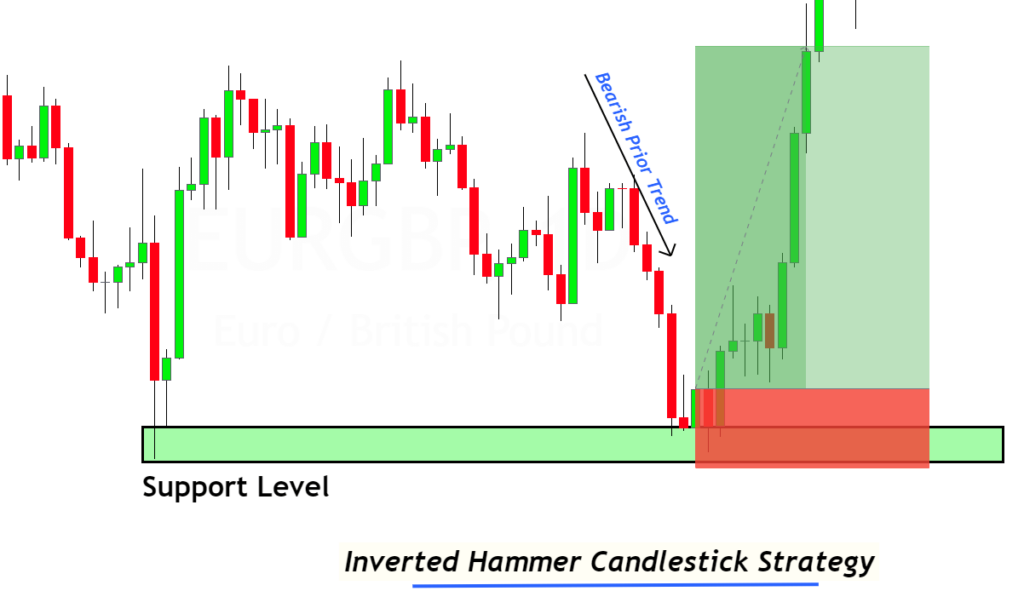
As you can see in the illustration above, whenever the price appears as a pin bar on the fractal line, it bounces , and then starts moving in the opposite direction. Therefore, during the course of a range, you can place a buy order when a bullish pin bar appears near the support level of the fractal. Conversely, a bearish pin bar that appears at the resistance level of a fractal can be a good signal to sell.
Whenever the price crosses a fractal line, it indicates a high probability of a possible price breakout. For example, if the resistance line of the fractal is broken, it means that it is a bullish breakout. For a reverse bearish breakout, you should wait until the price is below the support line of the fractal. We recommend setting up MT4 alerts close to the fractal line. This will allow you to be noticed when the price crosses key support and resistance areas in the market.
The strength and resistance of a fractal is an indicator that is not redrawn. This means that the fractal’s support and resistance levels do not change at the end of each price bar. In addition, the fractal is the same when used on charts with multiple time frames.
Summing up
Fractal arrows are an extremely popular trading indicator among Forex volatility traders. In addition the support and resistance fractal indicator is of great benefit to day traders who trade price action.


Responses