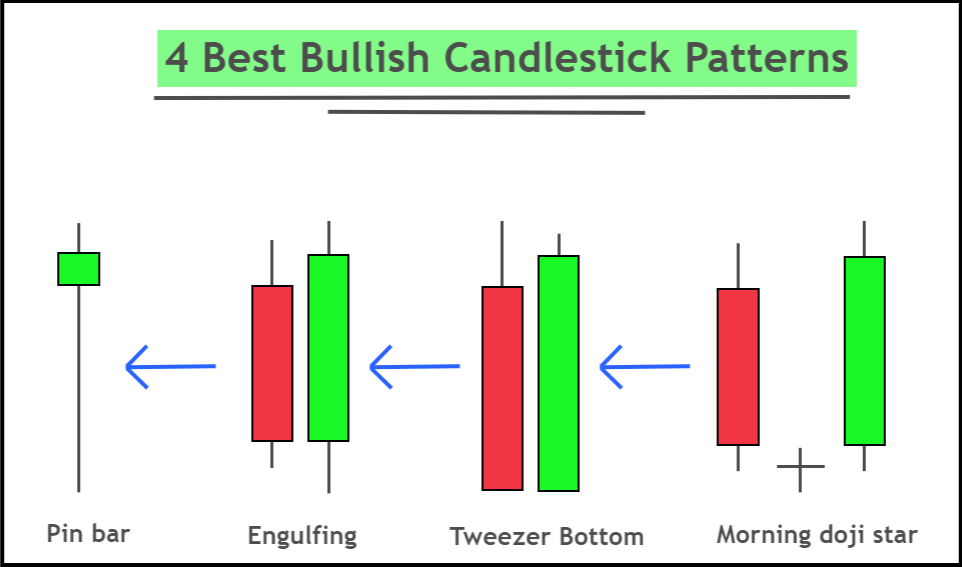
4 Best Bullish Candlestick Patterns
Bullish candlestick pattern refers to candlestick patterns which cause a change in a bearish trend into an upward trend, or continuation of a bullish tendency.
These patterns can be used to predict market movements and make decent profits in the financial markets.
This article will show you how to find the ideal candlestick pattern on the chart. Here are four patterns of bullish reverse candlesticks that have an excellent winning ratio.
[wptb id=16694]
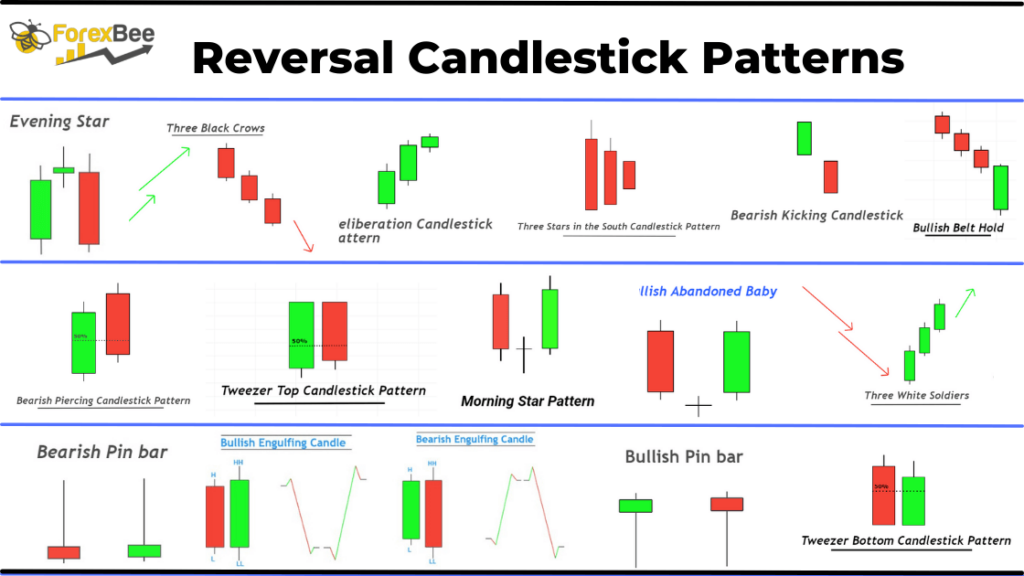
These are the top 4 bullish candlestick pattern.
Because these are bullish patterns, they can be used in any type of technical analysis. Many retail traders use these patterns to forecast market conditions.
These candlestick patterns are briefly explained here. You can also refer to the full article for more information and how it can be used in a trading strategy.
Bullish Pin Bar
Pin bars are a pattern of candlesticks that has a long tail and small body. The bullish pinbar will have the body at the top and the tail at the bottom.
This indicates that the trend is changing from bullish to bearish. That’s why pin bar candles mostly form at the end of the downtrend.
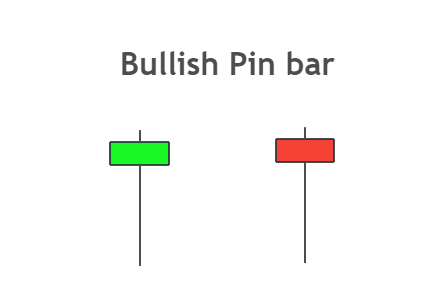
70 to 80% of candlestick’s total size will consist of shadow, and 20 to 30% will consist of body. The candlestick must have a body at its top. It should also be less than 30% wick to body ratio.
It doesn’t matter what the colour of your pinbar candlestick is, however it is a good idea to make sure that you keep the candlestick in the same range as the last candlestick.
This pin bar’s long tail shows sellers trying to lower the price. But buyers prevailed over sellers, pushing up the price. If this occurs at the key support level, a bullish trend reversal is possible.
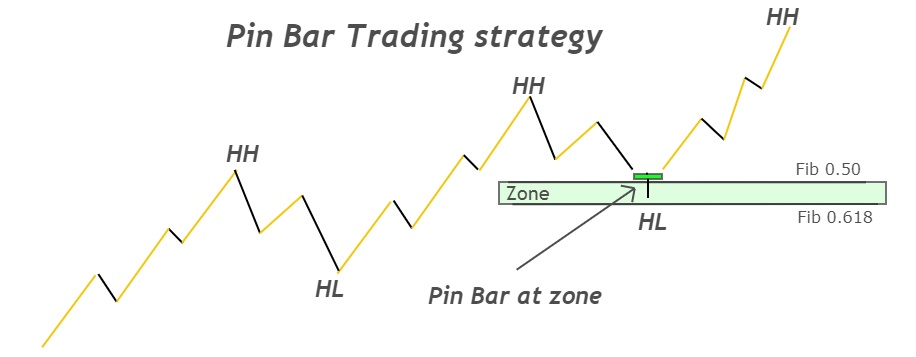
A strategy will help you learn the pinbar pattern.

With this course, you can find trade possibilities with high probability using ADVANCE candlestick patterns
ENROLL NOW
Bullish engulfing candlestick
An engulfing pattern is a combination of two candles. The second candle will swallow the first one completely. Bullish engulfing candlessticks will show a first candlestick that is bearish and a second one that is bullish. Advertisements
This means that sellers have been completely absorbed by buyers, which will cause the price to rise.
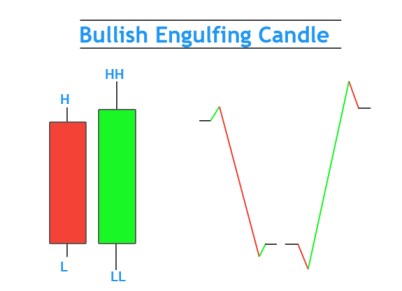
The body-to-wick ratio of both candlesticks in the engulfing pattern should be greater than 60% because the big body candlesticks show the market’s momentum.
It is a bullish trend reversal pattern that’s why it will mostly form at the end of the bearish trend.
Also, the modified pin bar structure in the engulfing patterns is used on a lower time frame. The trading psychology of pin bar and the engulfing patterns is identical, but they have a different timeframe and structure.
A strategy will help you understand the bullish engulfing patterns.
Morning doji star
Three candlesticks form the Morning Doji star, which is a bullish trend-reversal pattern. It includes a Doji and bullish candlesticks, as well as a Doji and bearish candles.
The body-to wick ratio for the bearish or bullish candles should not exceed 70% in this type of pattern.
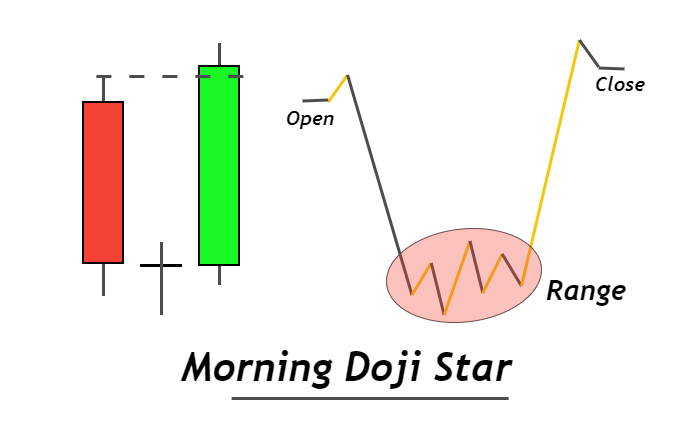
The pattern follows a clear logic. A bearish candlestick that forms during a downtrend shows sellers decreasing the price and it’s now oversold. The market will then form a Doji candle, which indicates that the bearish trend is over and is now looking for direction.
Following trend pause, the formation of large bullish candlessticks will signal the beginning of an exciting bullish trend.
A strategy will help you learn the Morning Doji Star in depth.
Pro Tip: Retail traders should place buy orders at the bottom of the downtrend or during oversold conditions.
Tweezer bottom pattern
Tweezer bottom patterns consist of two candlesticks that have the same structure from their lower sides. The closing price for each candlestick in this design will equal the opening price for the second.
First candlestick is a bearish one. Advertisements
Take a look at this image to get a better idea of the candlestick pattern.
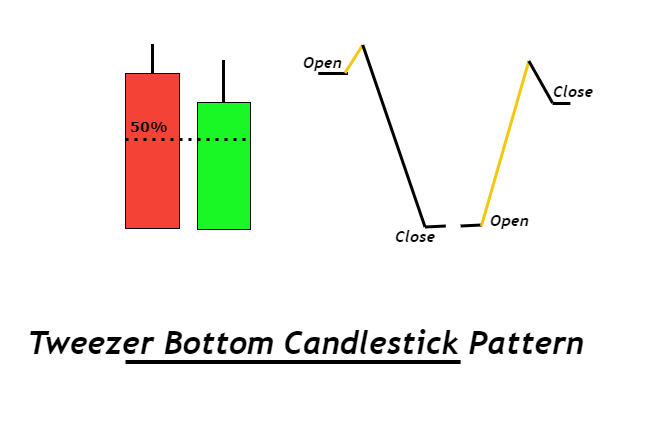
The second candlestick must always be at 50% or higher in tweezer bottom. It will be formed at the conclusion of the bearish price trend. If the bullish candlestick crosses the 50% mark, it means that buyers have cleared the major hurdle and the price is now on the rise.
Tweezer’s bottom is explained in depth with a strategy.
Conclusion
These candlestick patterns share the same trading psychology. This is due to time differences.
You will see that the pin bar candles made by all four of these patterns are more common if you look at them like a pro trader.
That’s why these are the best candlestick patterns and will work on the candlestick chart of every industry in this world.
[wptb id=16694]


Responses