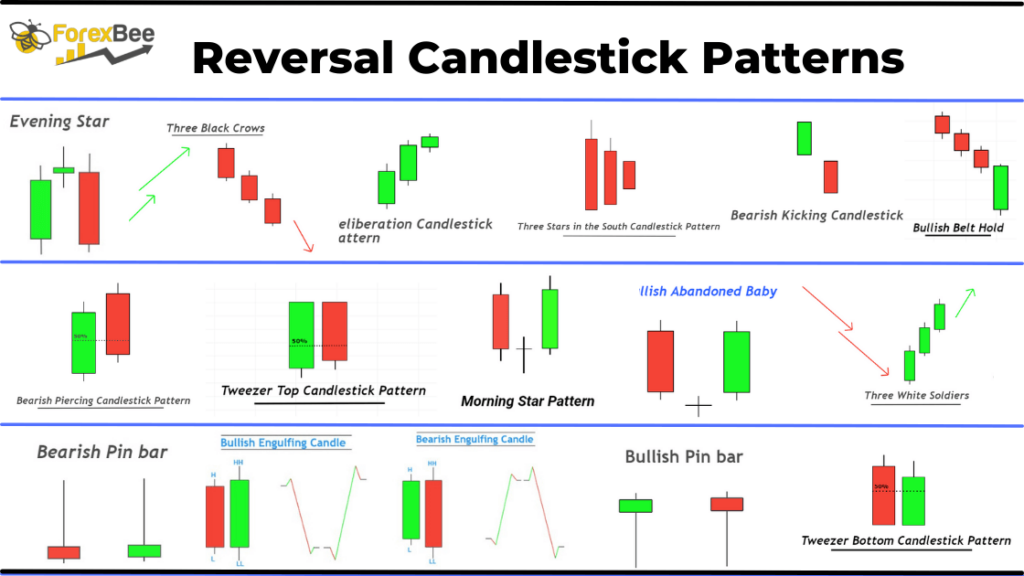
Bearish Piercing Candlestick Pattern: A Trader’s Guide
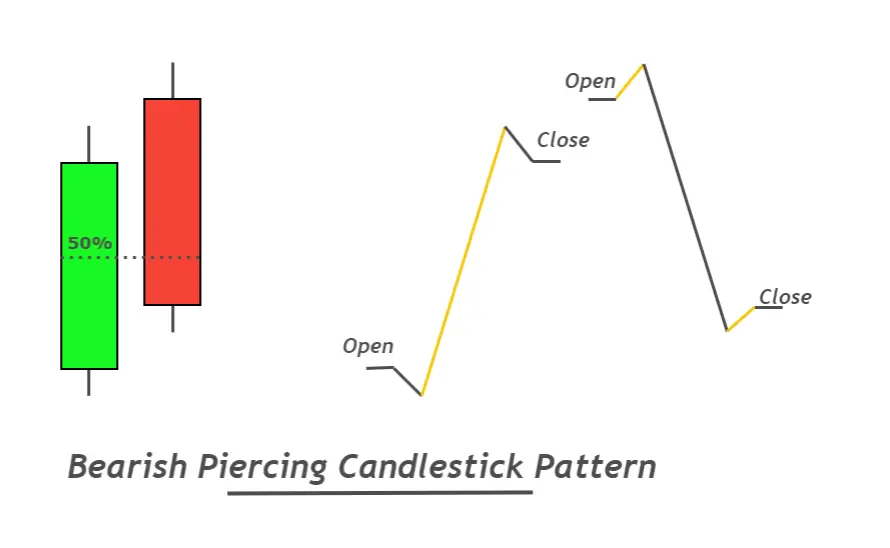
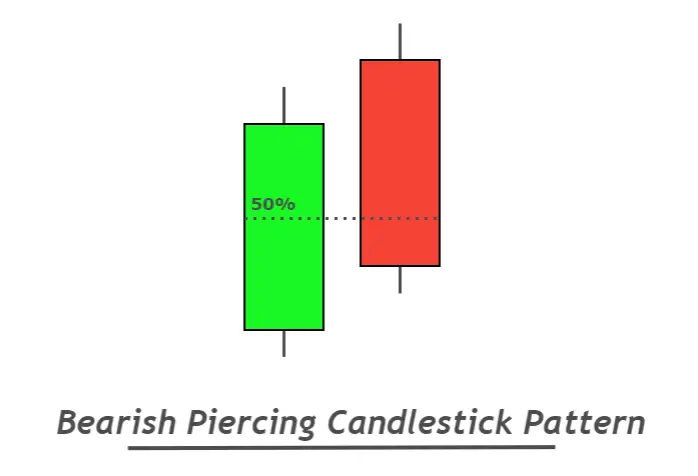
The bearish pattern is an inverse candlestick pattern with two opposite-colored candlesticks and a price gap between them. This pattern will see the bearish candles close below 50% of the previous bullish candles.
The bullish piercing is the opposite pattern. This pattern is most commonly seen in stocks and indexes. The top of the price charts is where it should be traded to achieve profitable results.
How can you recognize bearish piercing patterns?
A piercing pattern is created when a bullish and bearish candlestick are combined in the correct order.
Follow these rules to find a pattern in the price chart.
- The ratio of the body to wick for both bullish as well as bearish candlesticks should be higher than 60%. The body of the candles indicates the buying and selling momentum.
- After the formation of a bullish candlestick, a bearish one should open with an upward gap, and then close under the 50% level.
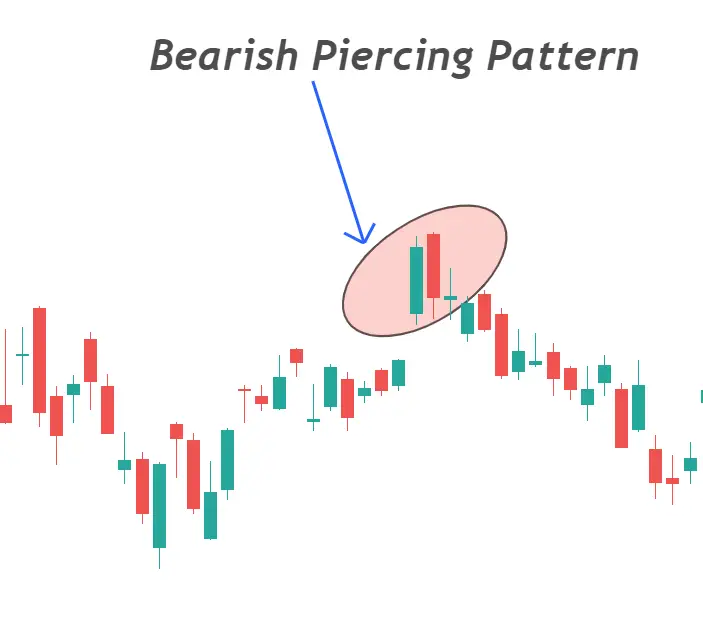
- This candlestick pattern is formed at the end of the uptrend
Best location to pierce candlestick patterns on price charts
The position of the candlestick pattern in relation to the chart is very important. Candlestick patterns can be used in both trending and sideways markets. Confluences can help you refine a trading strategy from the rest of the pack.
Here are three of the most common price confluences that can be used to create a high-probability candlestick pattern.
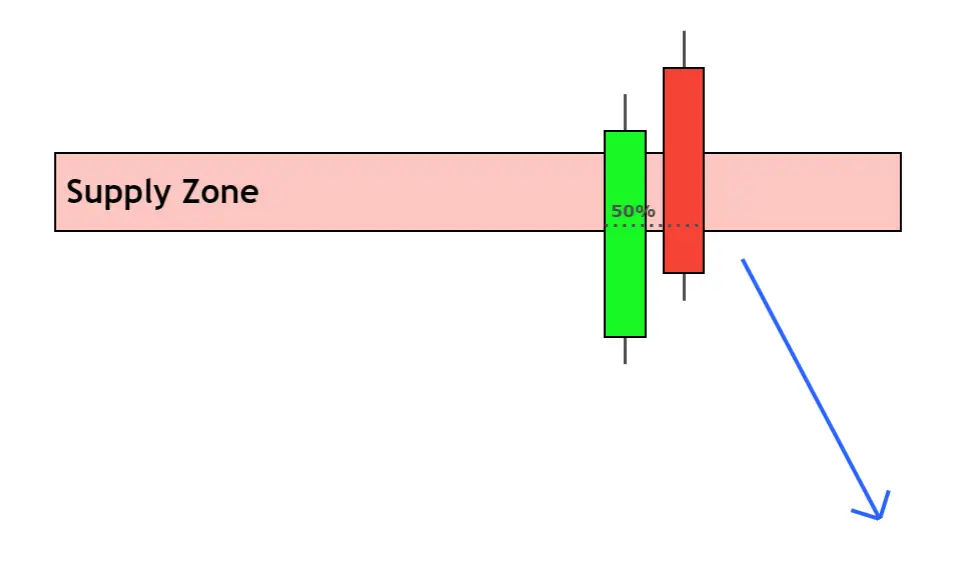
- Supply zone
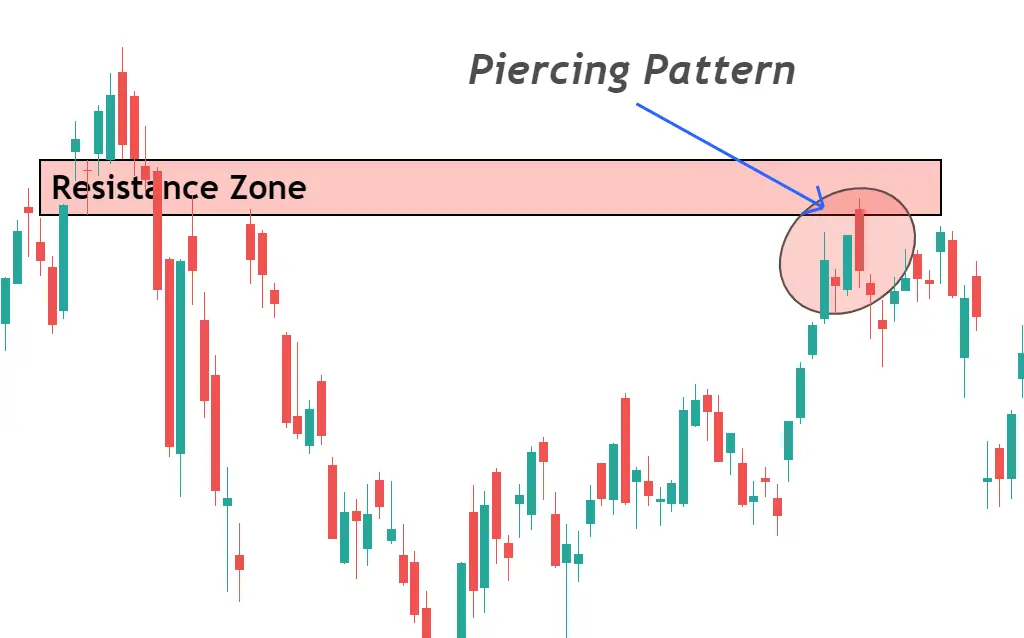
- Resistance zone
- Overbought level
Bearish Piercing: Information Table
| Features | Explanation |
|---|---|
| Number of Candlesticks | 2 |
| Prediction | Bearish trend reversal |
| Prior Trend | Bullish trend |
| Counter Pattern | bullish piercing pattern |
The psychology behind the bearish piercing pattern
The bearish piercing pattern represents that sellers have become more potent after a long uptrend than buyers, and now the price will decrease.
Let’s read the price…
The bullish trend before forming the candlestick pattern shows that buyers are weakening with time. Because after overbought conditions, the price will have to come down. Because buyers will not be able to hold the price up for a long time.
At some key level, institutional traders will try to capture the retail traders before price trend reversal because they don’t want retail traders to profit. So they will make a false breakout of key levels in the form of a gap. Because at resistance breakout, retail traders will buy thinking of a breakout, but market makers have thought of something else.
After the gap at the key level, a significant bearish candlestick will form that will close inside the key level and below the 50% level of the previous bullish candlestick. This indicates a false breakout because prices have closed below the resistance after the breakout.
So now the price will go down because sellers are ready to decrease the price.
Pro Tip: False breakout is an excellent signal of a price trend reversal. A bearish piercing pattern formation at the breakout level will generate a high probability signal.
How to Trade Bearish piercing Patterns?
Here I have explained a trading strategy based on supply zone and bearish piercing pattern.
Open a sell order
The first step is to find a strong supply zone on the chart. After identifying the supply zone, look for the formation of piercing candlesticks at the supply zone. The power of trend reversal of both technical tools candlestick pattern and supply zone will combine, and a solid bearish trend reversal signal will form.
Open a sell order just after the piercing candlestick closing.
Stop-loss level
Place stop-loss above the high candlestick pattern or the supply zone. Choose the highest point always.
Take-profit level
Close 75% of the trade at a 1:1 RR ratio and keep holding the trade until the trade setup achieves a 1:2 risk-reward ratio.
The Bottom Line
Due to the gap, only a few patterns form in the currencies chart. It usually forms in the chart of stocks and indices.
It is recommended to backtest this candlestick pattern at least 100 times before trading on a real account.
[wptb id=16694]


Responses