Bearish Kicking Candlestick Pattern: Full Trading Guide
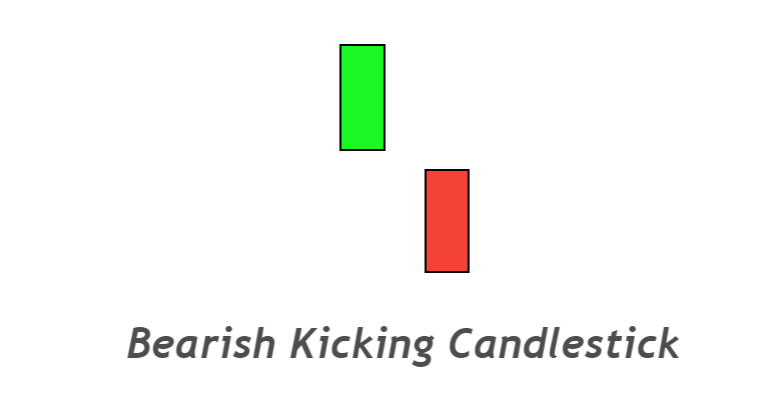
Bearish Kicking is a candlestick pattern that reverses the price trend. This candlestick pattern consists of two different-colored marubozu candlesticks separated by a gap. It will usually form near the top of the price charts or resistance/supply levels.
A bearish kicking candles is used for forecasting a market bearish trend. This candle is primarily found on the stock or index price charts. Sometimes, it acts as a continuation candlestick. To make the most of the trend, I’ll show you how to trade the reverse candlestick.
[wptb id=16694]
How do you identify a bearish-kicking candlestick
You need to be able to find the bearish Kicker (kicking), candlestick on your chart. Here are some guidelines.
- The chart will show a bullish marubozu candle, which is the first candlestick in the pattern.
- Bullish marubozu will be followed by a market open that has a gap. The second candlestick will then open at the close of bullish marubozu.
- This pattern’s second candlestick is a bearish marubozu, which indicates the huge momentum of sellers.
This is a mandatory criterion to determine ideal kicker candlesstick patterns. You should also refine trading patterns to improve your winning rate.
However, a blind trader of a bearish-kicking candlestick chart without confluences is not likely to make a profit.
Bearish kicking: Information Table
| Features | Explanation |
|---|---|
| There are many candlesticks | 2 |
| Prediction | Bearish trend reversal |
| Previous Trend | N/A |
| Relevant Pattern | Candlestick for kicker |
Psychology behind the Kicking Candle
You will learn how big traders trade behind the charts by reading a candlestick chart. This will help you make informed decisions.
Retail traders are always being deceived by big traders. They will always prevail. They are impossible to beat. Trade with major institutions is the most profitable way to make money, and not with retail traders who often lose out on the markets.
The price can be used to determine the direction of large institutions. A bullish-kicking candlestick would indicate a continuation of a bullish trend. The big white mass represents buyers’ momentum. The retail trader will be able to place buy orders with this candlestick.
However, after the bullish marubozu price opens with a gap up This huge price fall is due to institutional traders filling their sell orders. A significant bearish candlestick after this gap will then confirm the bearish trend.
This will lead to losses for retail customers. Then it’s time for traders and big-name Bearish traders to join the market.
Bearish kicking candlestick trading strategy
The combination of a bearish kicker candlestick and an exponential moving average creates this simple trading strategy.
A kicker pattern signals a market reversal, and EMA is used for trading this reversal to the trend.
How do you trade your kicking candlestick pattern?
First, ensure that the price is below the moving average. Open a buy trade when the price is below the moving average.
Trade until the risk-reward ratio is 1:2. For this purpose, you can use the Fibonacci Tool.
Let’s get to the bottom
Trade kicker candlesticks should be traded with technical analysis tools such as moving average.
Backtest your candlestick thoroughly before you use it to perform technical analysis in live trades.
[wptb id=16694]

Responses