Three Stars in the South Candlestick Pattern: Full Guide
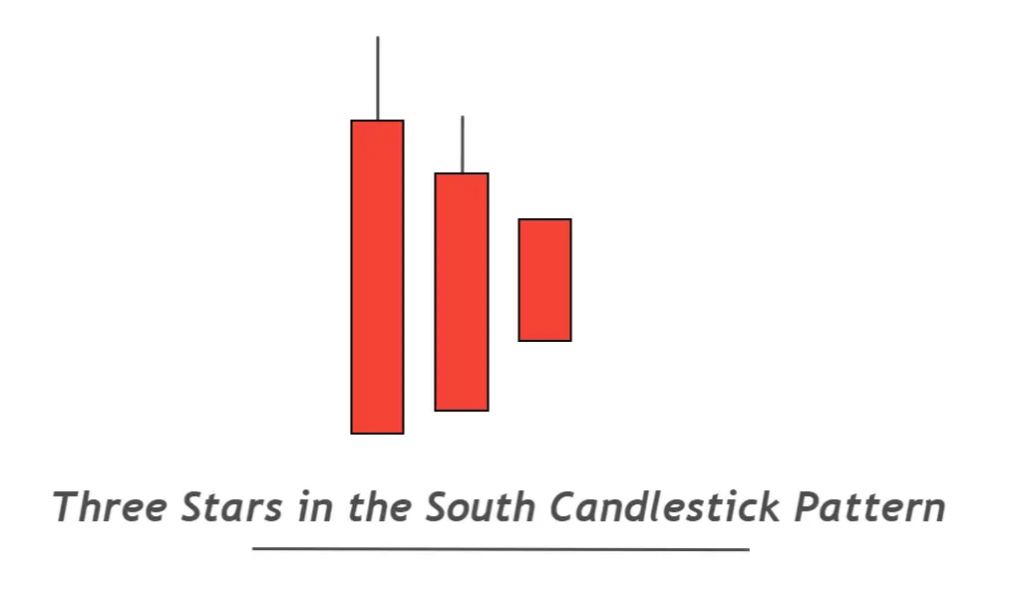
This candlestick has a very small probability of appearing on the candlestick charts. This pattern can be used to analyze trends and for other purposes in trading. This pattern is similar to the inside-bar candlestick pattern in structure, but the psychology behind both patterns is completely different.
How do you identify the three stars of the South pattern?
This candlestick pattern can only be found on a price chart if you follow all the criteria. This pattern is formed after three bearish candles are formed in a certain sequence and shape.
Here are a couple of guidelines
- The first candlestick represents a major price decline. Usually, a large wick forms on the upper part of the first candlestick.
- It is also a bearish/red candlestick and forms within the first big candlestick’s range. The candlestick will form a high low and low high similar to an inner bar candlestick. A small wick will be on either the upper or lower part of this candlestick.
- The third candlestick is a small marubozu bearish candlestick. It will also be within the range that the previous candlestick made, making a higher low and a lower high.
Here are some simple rules to help you identify the three-starred candlestick pattern.
Three stars pattern in the South: Best conditions of work
This trade setup will have greater success if I can filter three confluences.
-
- Support zone: There are several chances for a bullish trend to reverse when the three stars of the south pattern appear at the level of support.
- Demand zone: Buyers in the demand zones wait for the price of their order to be filled by the price.
- Oversold Condition: A three-star pattern in the south will increase your chances of winning if you are trading under oversold conditions. RSI is a good indicator to use when determining oversold situations.
Three stars south: Information table
| You can find out more about this by clicking here. | Explanation |
|---|---|
| Number of Candlesticks | 3 |
| Prediction | Bullish trend reversal |
| Prior Trend | Bearish Trend |
| Relevant Pattern | Inside bar |
The Psychology of the three-star pattern in the South
The psychology of each candlestick pattern lets us know the trading activity behind the chart. We can then forecast the price based on their actions.
If you have three stars on the candlestick pattern to the south, the first big candlestick bearish represents that the sellers now control the situation and the price has dropped for an asset or currency. The price is now in an oversold state.
The next candlestick within the range of candlesticks before it shows that the sellers have not been able to reach a lower low. They are unable to continue the downtrend. The buyers have done their best but they still are not able to make a higher high. There is a trend pause in the market.
The third candlestick, with its small body size, indicates that buyers and sellers have equal forces. The sellers have lost their previous momentum and the buyers have gained it. The small price changes in the market can also be a sign of the coming storm.
After the pattern has been completed, a bullish candlestick that breaks the highs from the three previous candlesticks will be formed, and a bullish trend will begin.
Why not exchange the three stars of the South pattern?
This candle pattern is not recommended for trading. You can use it to analyze a stock or currency.
There are restrictions
- Low winning rate
- Negligible rate of occurrence
- It is very difficult to predict take-profit levels
Bottom Line
For the best possible results, you should always choose only a handful of patterns. These patterns are not the only ones that can be used as an analysis tool.
You found, for example, three stars on the daily candlestick pattern of the south. You realized that the market was going to reverse and the bullish trends were about to start. You’ll have to change to a lower timeframe and only use your strategy to move in a bullish way.


Responses