High Wave Candlestick Pattern: Definition & Trading Strategy
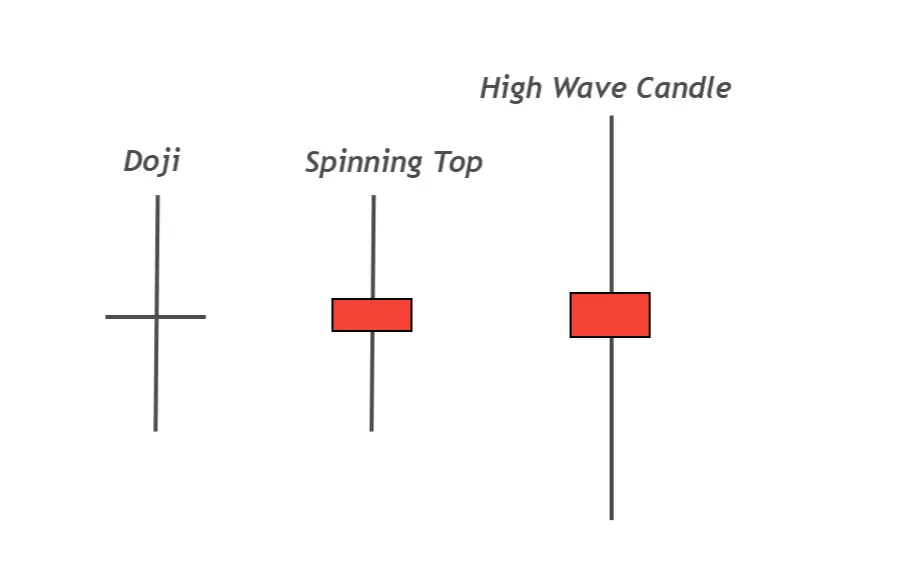
The High wave pattern is a candlestick pattern with large wicks/shadows than the average size of a candlestick. The body of the candlestick is tiny compared to the shadows.
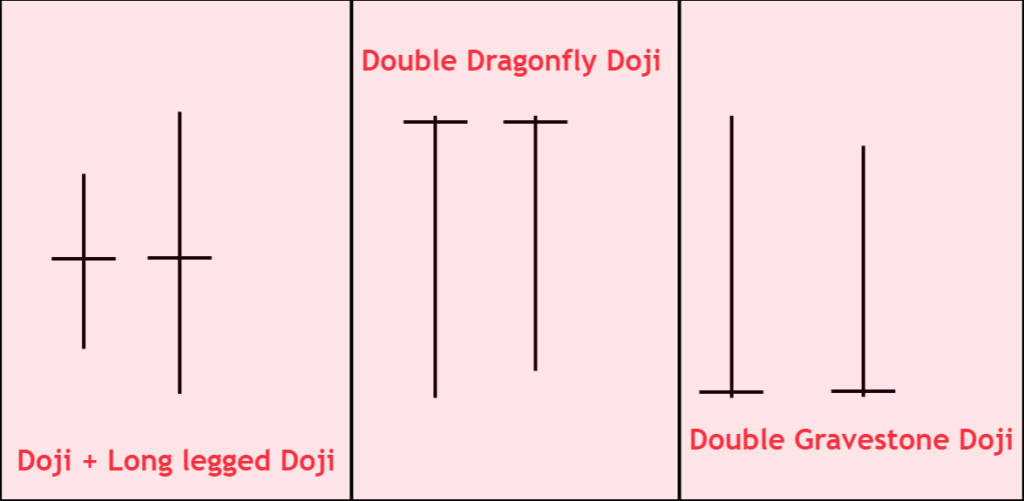
It is like a spinning top or long-legged Doji candlestick. This candlestick pattern shows that market makers are deciding their direction. It is also used as a stop-loss hunting pattern by big traders & institutions.
How do you identify a High Wave Candlestick?
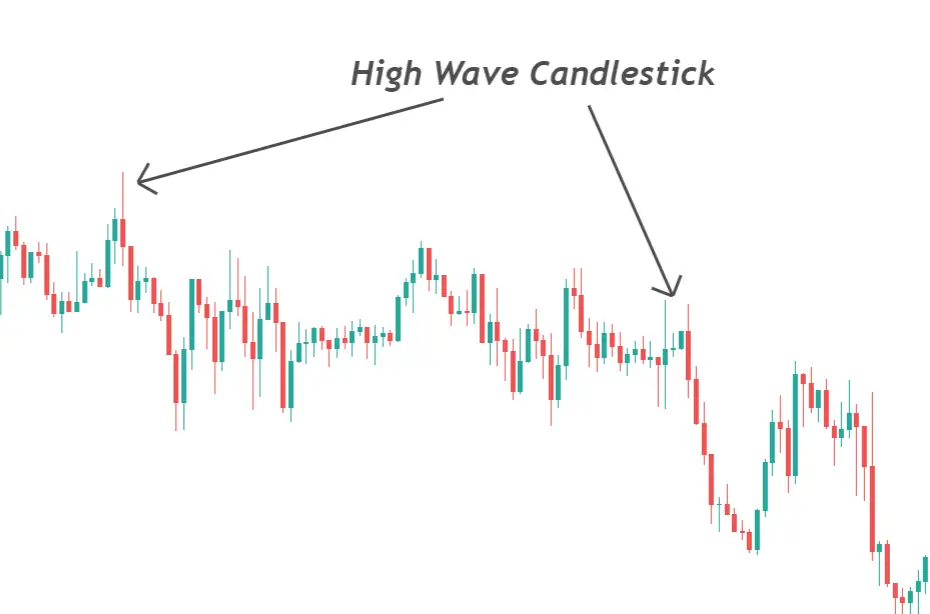
The candlestick pattern is usually formed at resistance or support levels, as these are the decision points.
Here are a few things you should know about identifying a high-wave candlestick pattern. Here’s the guide
- It is because this candlestick is a high-wave candlestick that the total size should be larger than the previous 20 candlesticks. This means that big market movements will occur during this time.
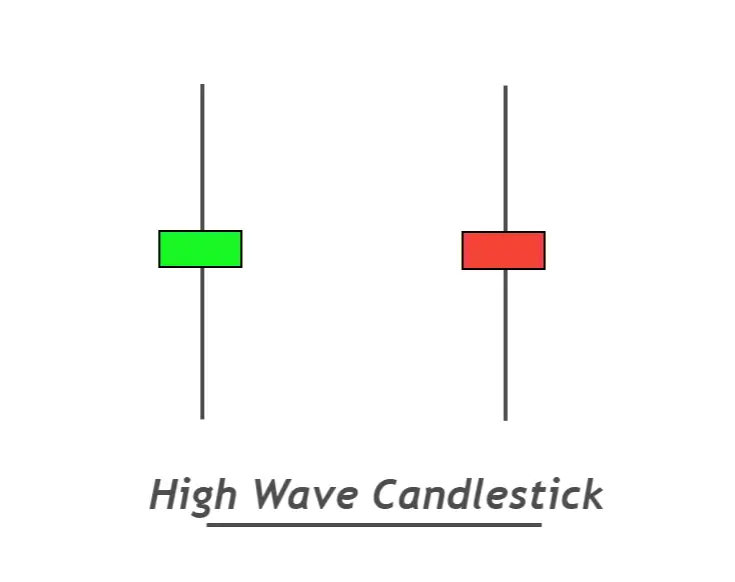
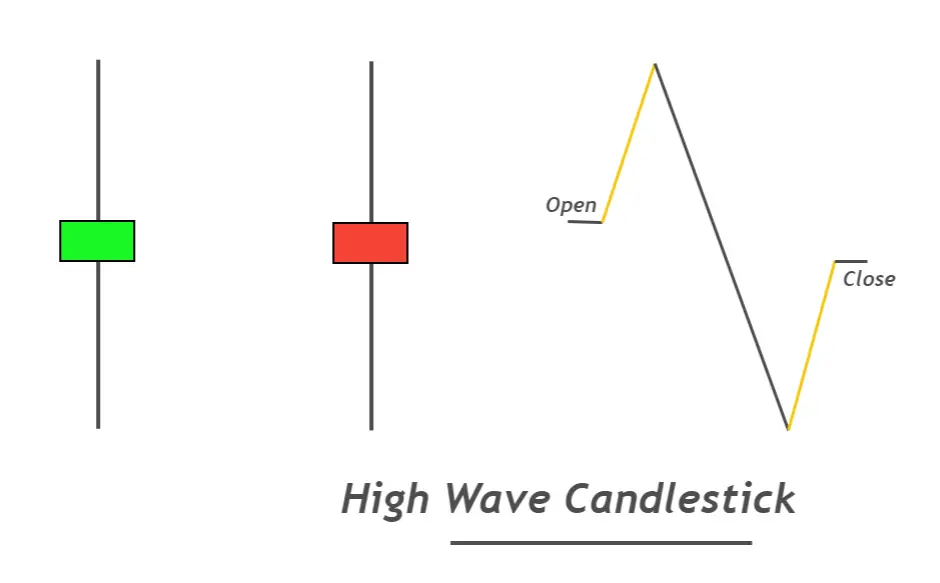
- The candlestick body should be smaller. The body-to-wick ratio for high-wave candles is usually below 20%. Market activity can be explained on the chart by the large shadows that appear above or below a candlestick pattern.
- It does not matter what color the pattern is. For example, it could be green or red in a spinning-top candlestick pattern.
You can easily identify the high-wave candlestick patterns by following these three steps.
You could refine your setups by establishing some rules.
High-wave pattern: best working conditions
The price chart will not accept every High wave pattern. We can trade good candlestick patterns only if we meet certain conditions.
- High-wave candlestick patterns have a low rate of success during market conditions. This pattern should not be traded during range.
- The winning ratio for the High Wave pattern is higher when it forms in Support/Resistance zones or Supply/Demand Zones.
- Use the Relative Strength Index indicator to determine conditions of overbought or oversold. Trade at levels of overbought/oversold conditions.
High Wave Candlestick Information Table
| The following are some examples of | Explanation |
|---|---|
| Candlesticks | 1 |
| Prediction | Indecisiveness in the market |
| Prior Trend | N/A |
| Counter Pattern | Dojis with long legs |
What can traders learn from the high-wave candlestick pattern?
This pattern’s psychology is similar to that of the top-spinning candlestick. However, there is only a small size difference.
The candlestick pattern with high waves indicates that market makers will be making future decisions about the price.
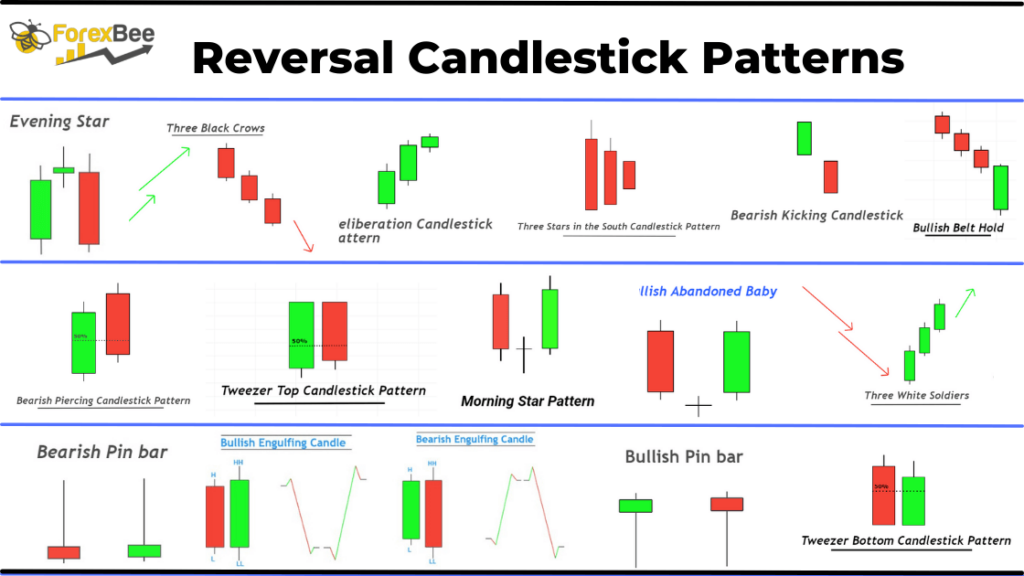
This is both a continuation and reversal candlestick pattern. The breakout of the candles confirms the price direction.
The price will move to the low or the high of the high wave candlestick after forming it. These price values will then act as support or resistance levels. When the price breaks out of the low or high candlestick, the trend is confirmed.
You can, for example,
- The break of the high of this pattern indicates that a bullish tendency will begin.
- A break of the low in this candlestick pattern indicates a trend that is bearish.
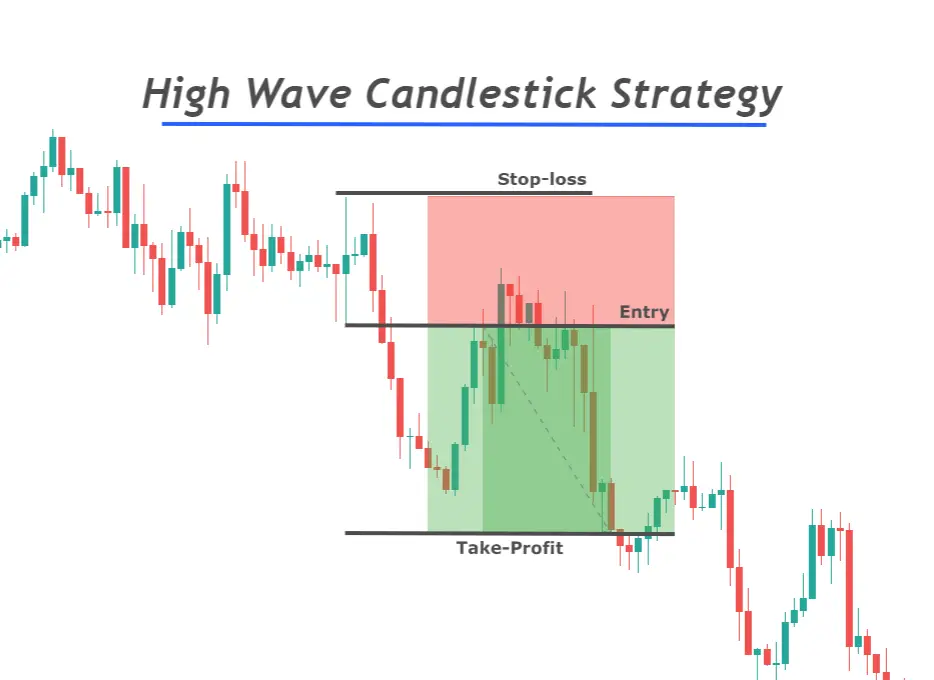
How to trade high-wave candlestick patterns?
I’ll explain here a simple break-out strategy. It can be used for analysis.
Pending Buy/Sell Stop Order
Set pending buy stops above the high of the candlestick pattern. Adjust stop-loss levels below the candlestick low.
After buying stop, place the pending stop-loss below the low of the high wave candlestick.
If one of the two orders above will be filled, delete the other order. As an example, if the buy-stop order is fulfilled, you can delete the sell order.
Risk-Reward Ratio and Take Profit Levels
You can also extend the take-profit levels by using a break-even strategy or other technical tools. By using the breakeven strategy and other technical tools, you can extend take-profit levels. It would be helpful if you tried to break even the trades after 1.6 RR.
The Bottom Line
Remember that every candlestick pattern is not going to work the way we expect. It is important to add a confluence of other technical indicators in order to increase your winning ratio.
Backtest your trading strategy before trading on a real account.
[wptb id=16694]

Responses