Volatility Indicator

The Volatility indicator in MT4 Forex Technical Indicators is best suited for trending forex traders and intraday traders. It allows traders to measure the true level of volatility in the forex market.
Price movements are directly related to forex market volatility. When the market price changes rapidly, the market volatility rises. When the market price changes slowly, market volatility decreases.
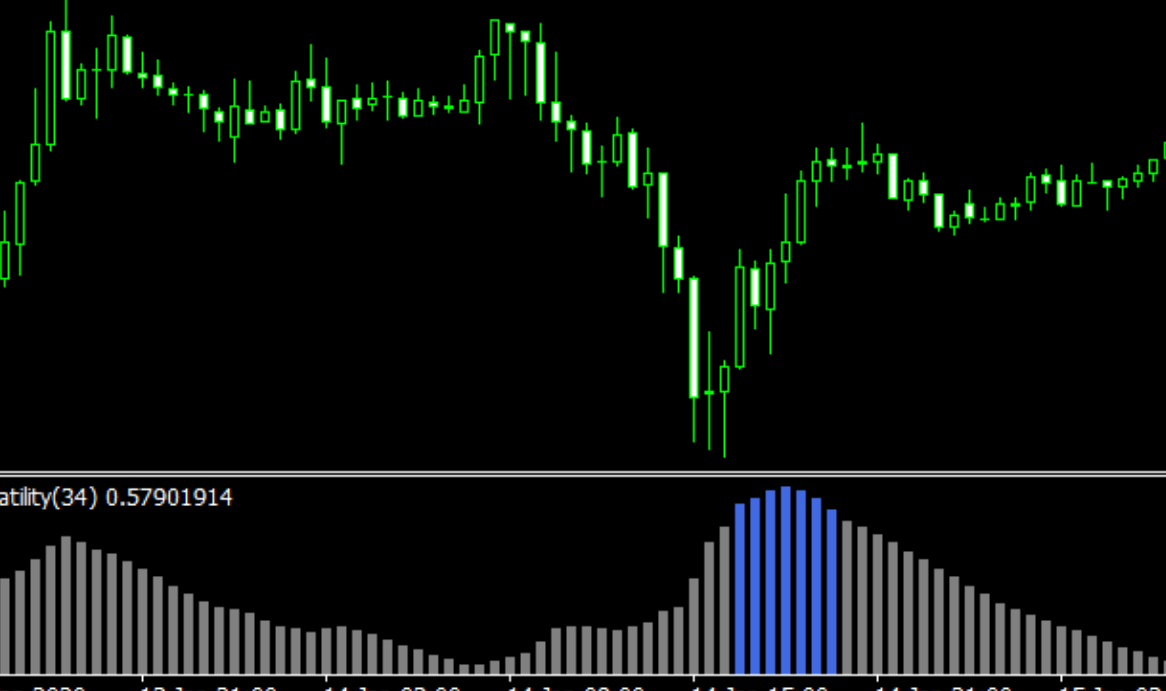
The indicator measures the volatility of the Forex market by comparing volume with the exponential moving average (EMA). The indicator displays a colored histogram that shows the level of volatility. Market volatility affects the color of the bars in the histogram.
Royal blue bars indicate high market volatility, while gray bars indicate low market volatility. The length of the bar indicates whether volatility is increasing/decreasing.
The bar chart bars provide traders with information that can be used to interpret and determine if there is enough market volatility to trade.
Volatility Indicator Buy/Sell Signals
The chart shows a volatility indicator that indicates the trend of EURUSD market volatility. It is easy to see that when a royal blue bar with high volatility is plotted, the market is volatile. The market can also be referred to as trending. On the other hand, low volatility gray bars indicate that the market moves very little. The market is also said to be consolidating.
Many traders, especially intraday traders and forex trend traders, prefer to open market orders when market volatility is high. This is because the market experiences significant price fluctuations, which will result in good profits for the trader if his market guesses are correct.
However, the MT4 Volatility indicator does not indicate which trades to place. the MT4 indicator provides information about market volatility and helps traders determine whether it is appropriate to trade.
The indicator should be used together with other indicators, such as the channel indicator, trend indicator and fractal indicator. It can help determine the market trend and which trades are most suitable according to the trader’s trading strategy.
The trader should wait until they have identified a trading opportunity to trade (buy or sell) according to their trading strategy. He waits for the royal blue bar to form in the bar chart of MetaTrader 4’s Volatility indicator to make their trade.
When volatility starts to fall, the trader should close the position or exit the trade. This is indicated by the decreasing bars in the bar chart. This is because
Conclusion
Forex traders can use the Volatility Indicator to MT4 to get valuable information. This allows them to determine if the market conditions are favorable for placing trades. It also allows traders to identify market conditions. They can then react to the trading signals generated through their trading strategies.

Responses