MACD Divergence Indicator
Divergence in the Forex market is the most effective way to determine if a trend is about to continue or reverse. Divergence” is used to describe a situation where both the oscillator and the exchange rate are moving in the direction of divergence.
The most effective oscillator for detecting divergence is the MACD Divergence indicator.

MT4’s MACD Divergence indicator allows traders to detect any deviations in price and MACD. The indicator has a volume histogram, as well as a 12 EMA and a 25 EMA.
The MACD volume histogram shows the strength as well as the direction of the trend. Therefore, the 12 and 25 EMAs of the MACD are used to determine trend reversals.
MT4’s MACD Divergence indicator is capable of detecting both regular and hidden divergences. Professional traders use this indicator to make risky and more profitable trades. The indicator can also be the most effective way to detect potential trend changes or continuation in advance.
How to use the MACD divergence indicator to spot potential divergences
Divergence is usually divided into two types – implicit divergence and regular divergence. A regular divergence is a sign of a reversal of a trend, while an implicit divergence is a signal that the trend is continuing.
A bullish regular divergence produces an upper low in the MACD when the price has a lower low. Conversely, a bearish divergence leads to a lower high in the MACD while the price has a higher high.
Bullish divergence leads to a lower low in the MACD when price creates a higher low. Finally, bearish implicit divergences create upper MACD highs as price is creating lower highs.
How to trade with MACD divergence indicators
A bullish regular divergence signals the end of a downtrend and the beginning of an uptrend. Therefore, a bullish regular divergence is a signal to buy.
A bearish regular divergence pattern signals the end of a downtrend and the beginning of an uptrend. Therefore, a bearish regular divergence can be a sell signal.
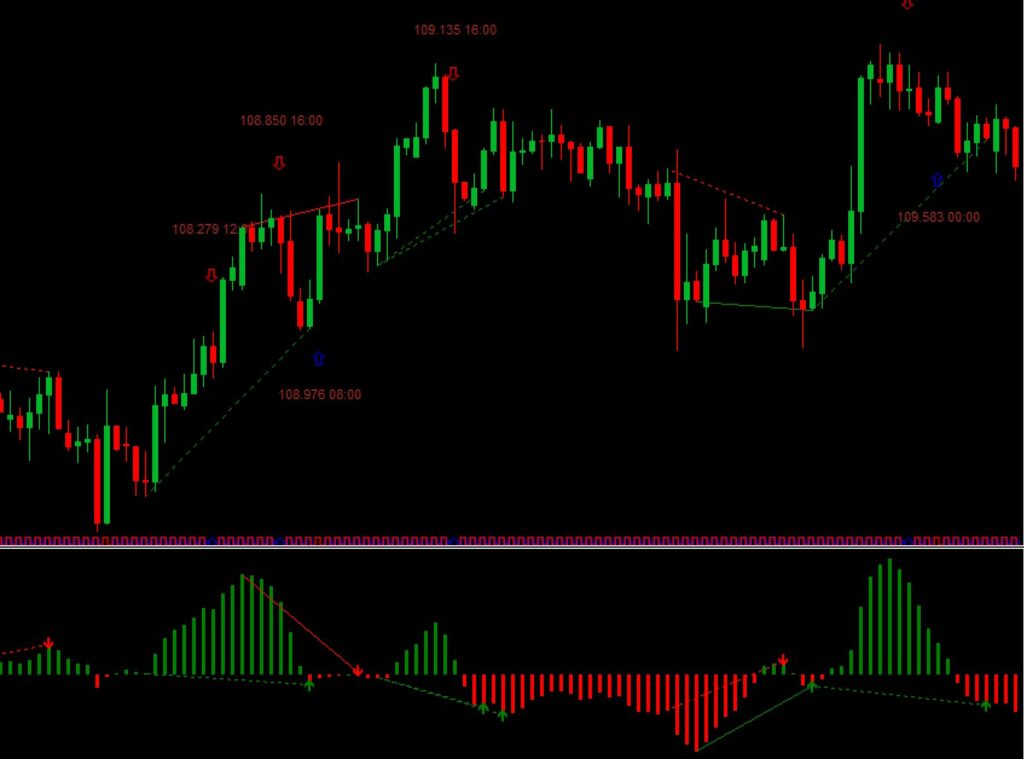
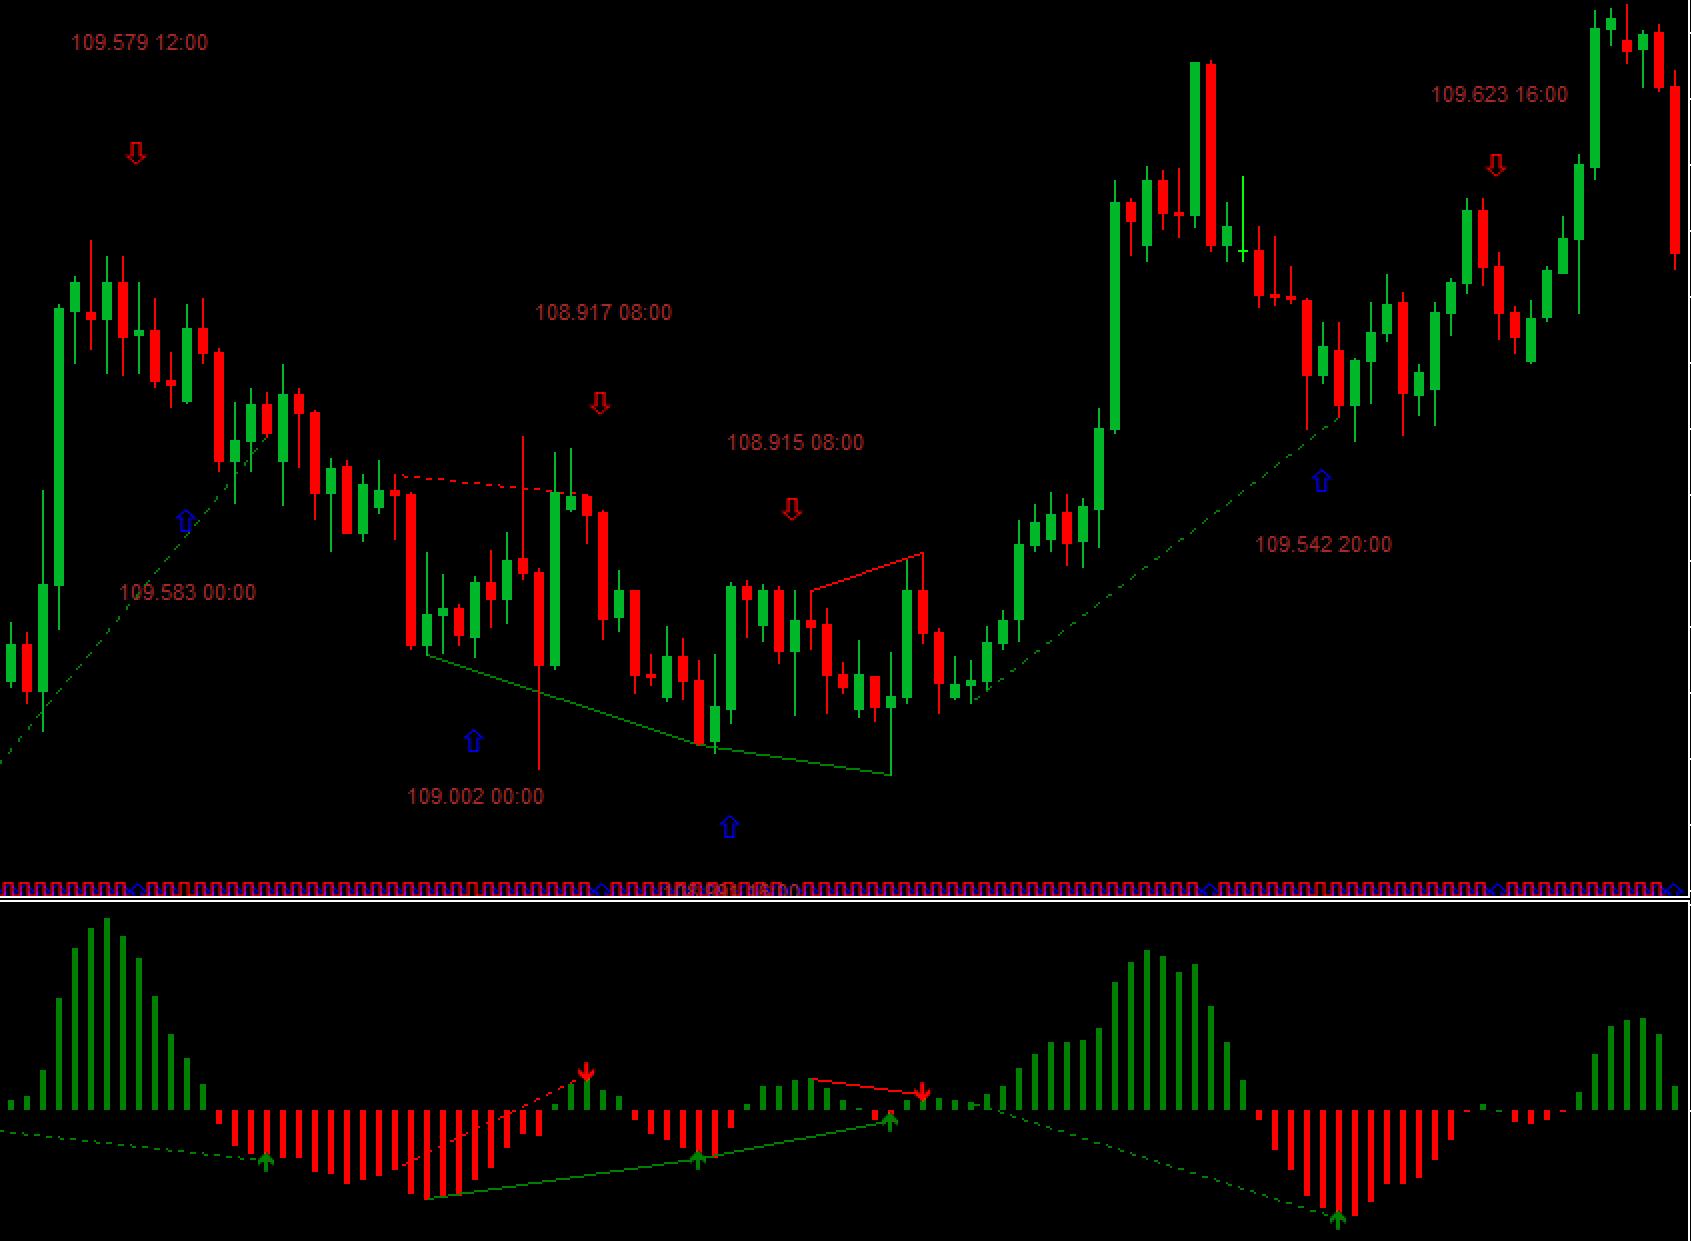
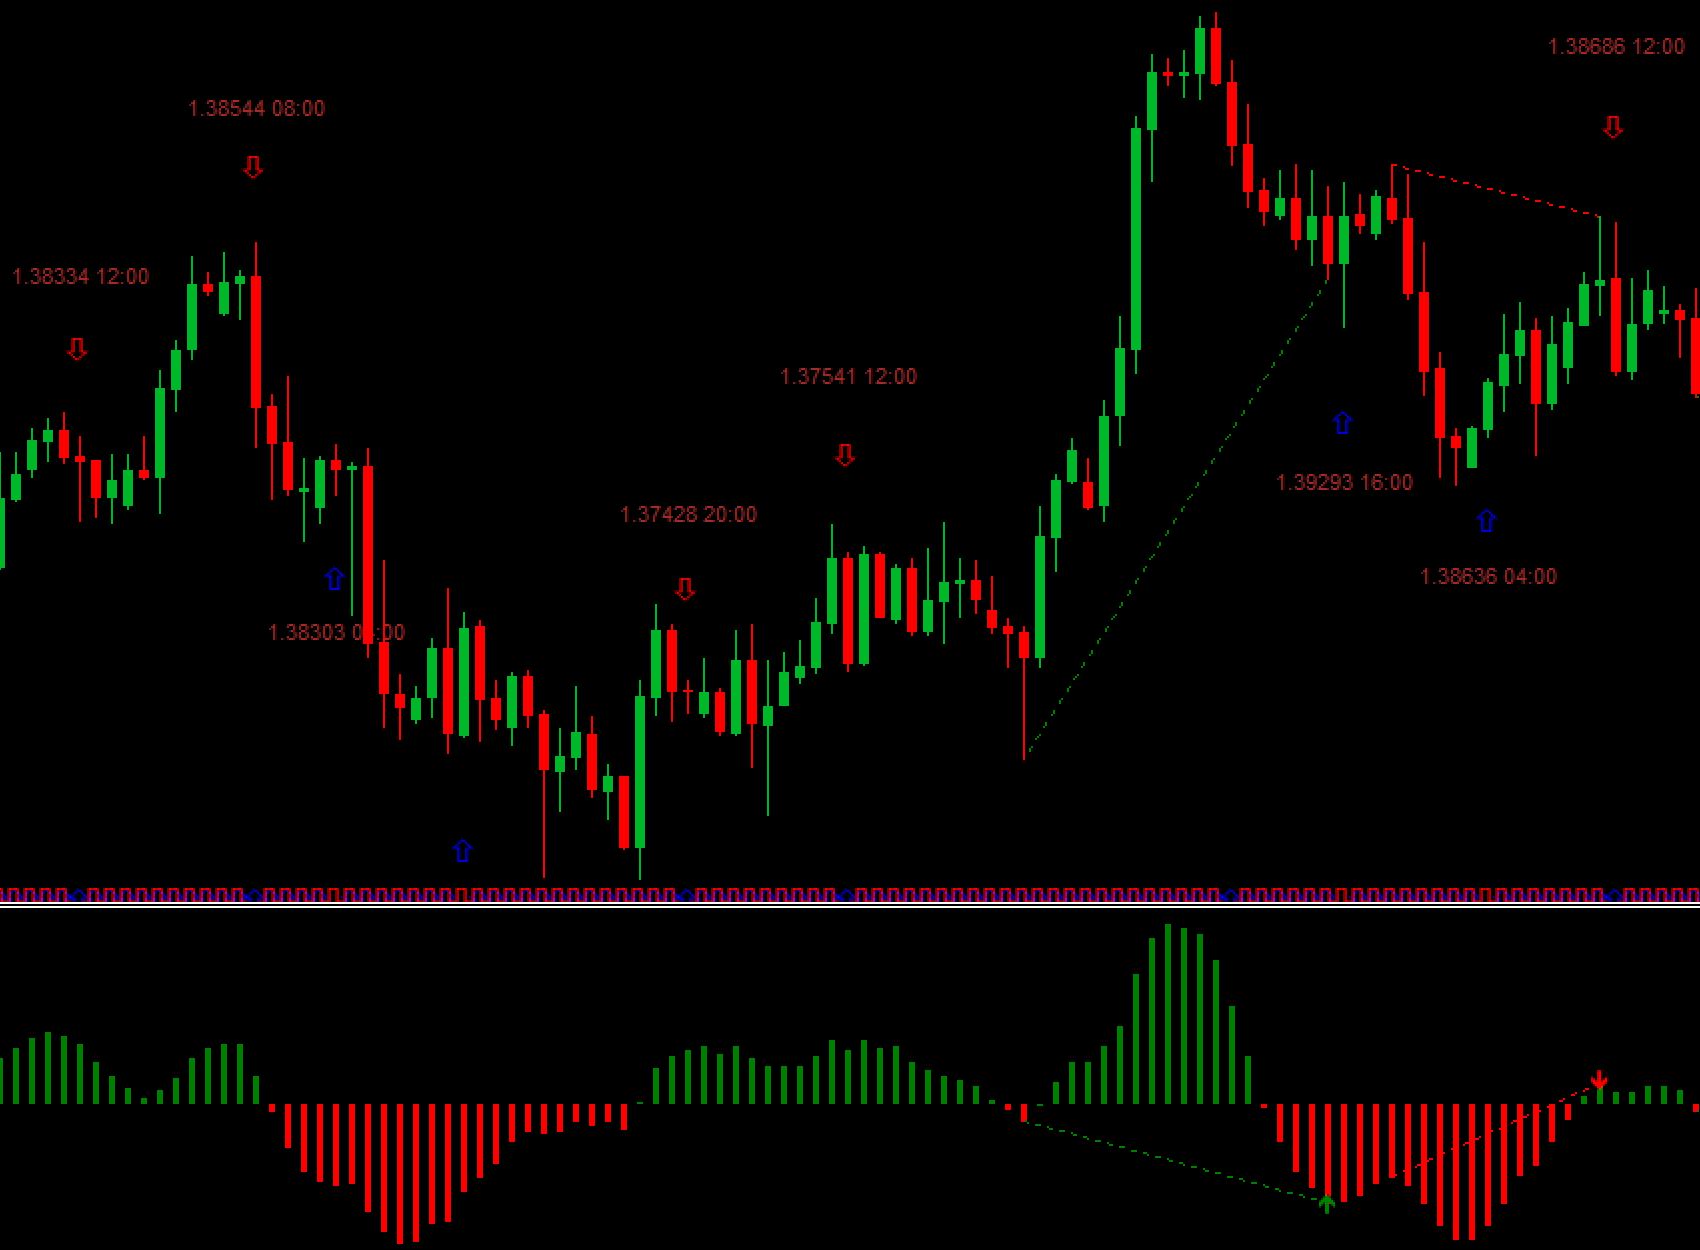
In addition, hidden bearish divergences signal the continuation of an uptrend and can be a buy signal. The chart below for EUR/USD illustrates the best way to enter and exit trades using this indicator.
A hidden bullish divergence is created between price and the indicator. This divergence is outlined by the red trend line on the chart and indicator. This is why the MACD divergence indicator clearly indicates that the trend may increase.
On the chart, there is a typical bearish divergence. This divergence is highlighted by the green trendline on the chart and in the indicator. Therefore, the indicator suggests that this could be a downtrend.
Summary
MT4’s MACD Divergence indicator helps Forex traders spot divergences between value and MACD. The indicator can be used alone or in conjunction with other price actions. For best performance, traders should apply the indicator on H1, H4 and daily timeframes.
[signinlocker]
MACD-Divergence-Indicator.ex4
[/signinlocker]

Responses