Three Black Crows Candlestick: A Trader’s Guide
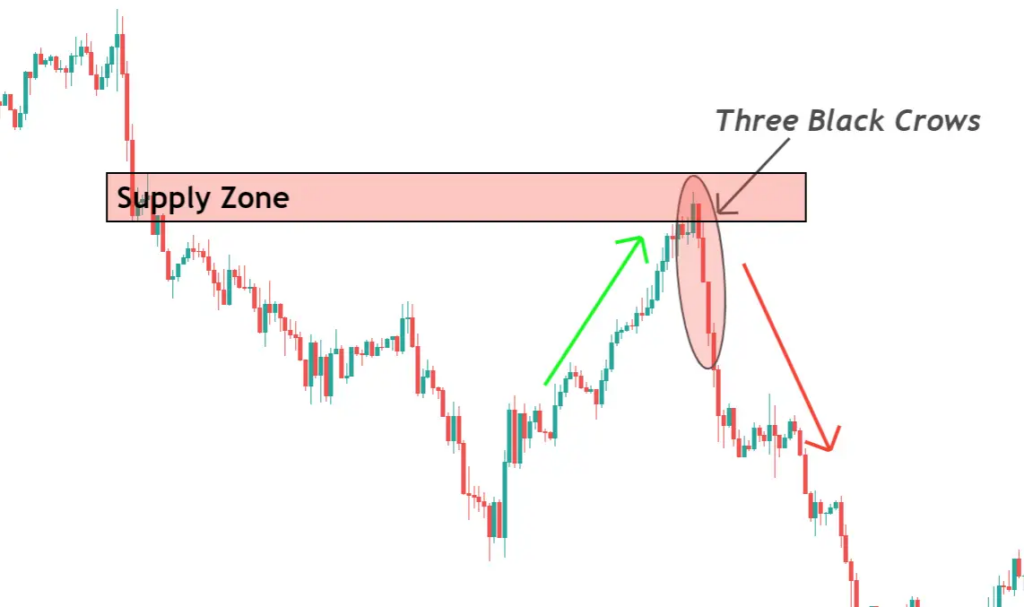
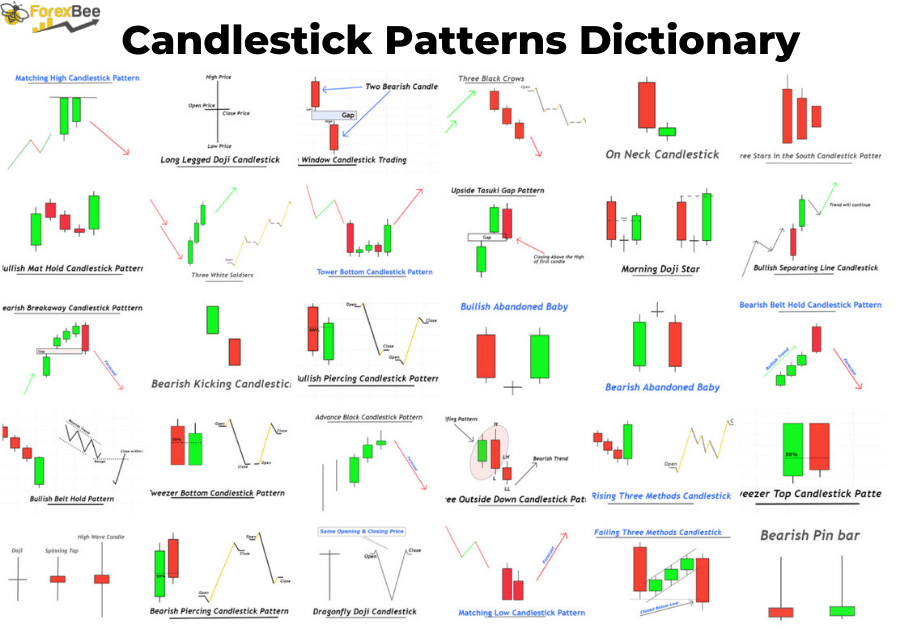
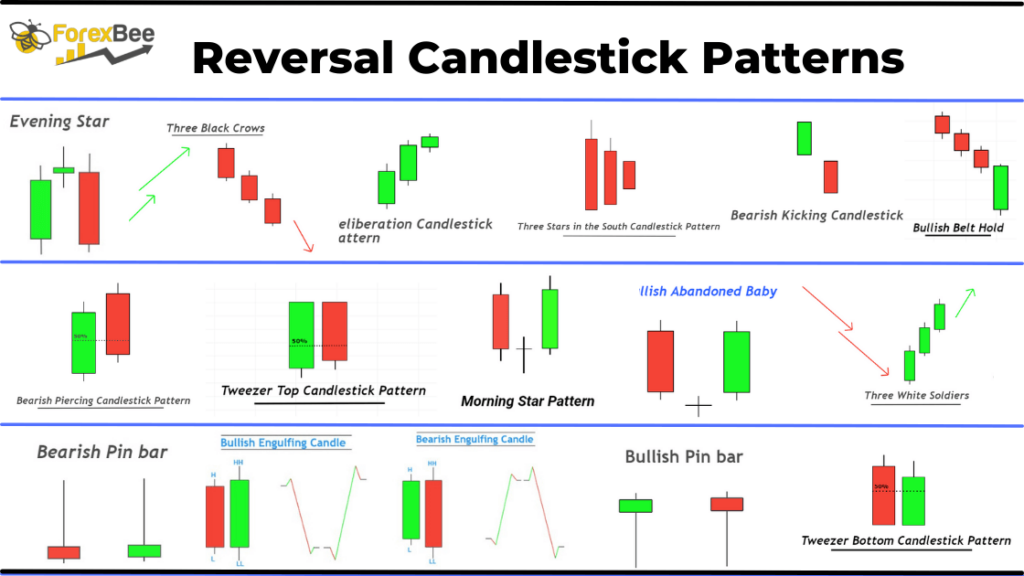
Three black crows candlestick pattern is a reversal of a bearish tendency. It consists three large bearish candlesticks that make lower lows and higher highs. Three black crows is a bearish trend reversal candlestick pattern that consists of three big bearish candlesticks making lower lows and lower highs.
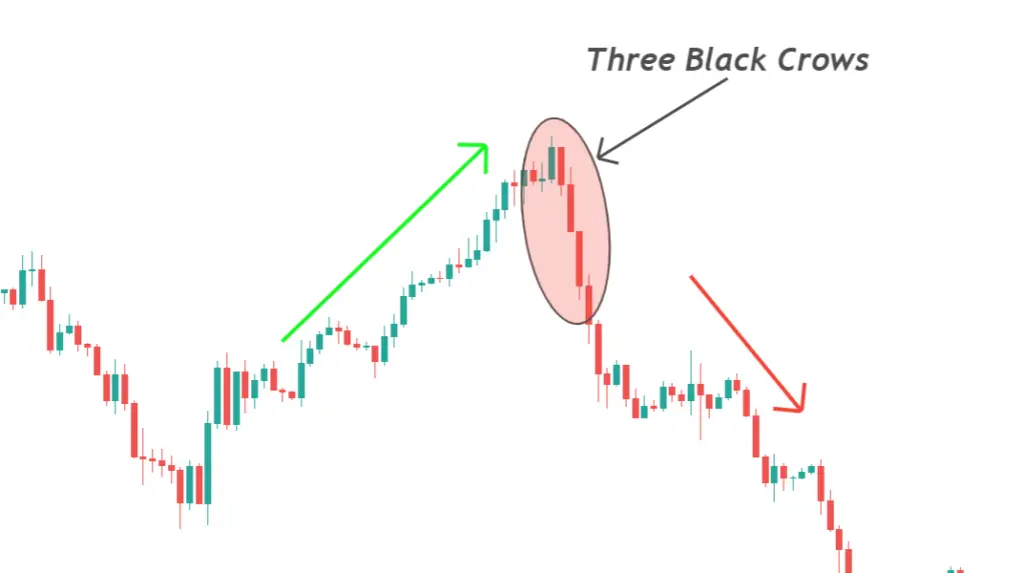
For a high-winning rate, the three black crows should appear at the peak of an upward price trend. This candlestick pattern will reduce the probability of winning in a sideways or choppy markets.
How can you find the three black crows pattern?
The ideal candlestick has certain rules. This makes it easier for traders to spot the perfect pattern in the price chart.
Trading will not require you to trade every candlestick pattern. Instead, only the refined patterns are required to achieve a high win ratio.
This guide is for three black crows
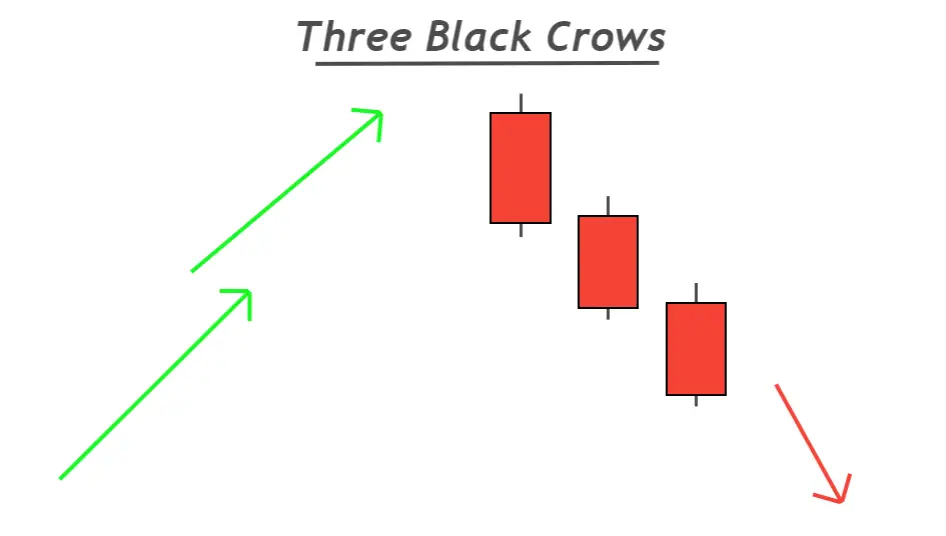
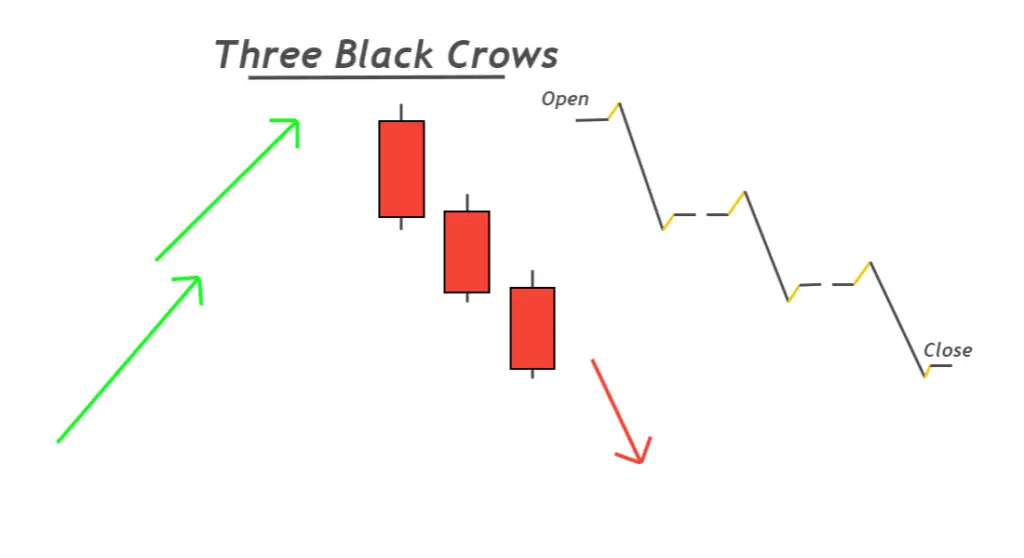
- Each candlestick’s body-to-wick ratio should be higher than 60%, as the large body shows the selling momentum.
- The two final bearish candlesticks will form lower lows, and lower highs. It is the start of a trend that is bearish.
- The wicks or shadows of the three candlesticks must be small. The market is indecisive when it has large shadows. Do not trade patterns with large shadows either above or beneath the candlestick.
Pro tip: Technical analysis is a way to try and predict the market using traders’ strategies, the footprints of large institutions and the price action of traders.
What are the best working conditions for black crows?
I have added a few confluences to increase my chances of winning. Confluences are a way to filter out the odds of a trading pattern and get better results. Backtesting is the only way to determine what type of confluences you should include.
The three confluences of this candlestick pattern are shown below.
- Prior to the formation of the three black crows, the trend should have been bullish. This will not work on a choppy stock market.
- The swarm should be centered at key supply zones or resistance levels.
- Use the RSI to identify overbought situations and only trade these patterns.
Three black crows – Information Table
| The following are some examples of | Explanation |
|---|---|
| Number of Candlesticks | 3 |
| Prediction | Bearish trend reversal |
| Prior Trend | Bullish Trend |
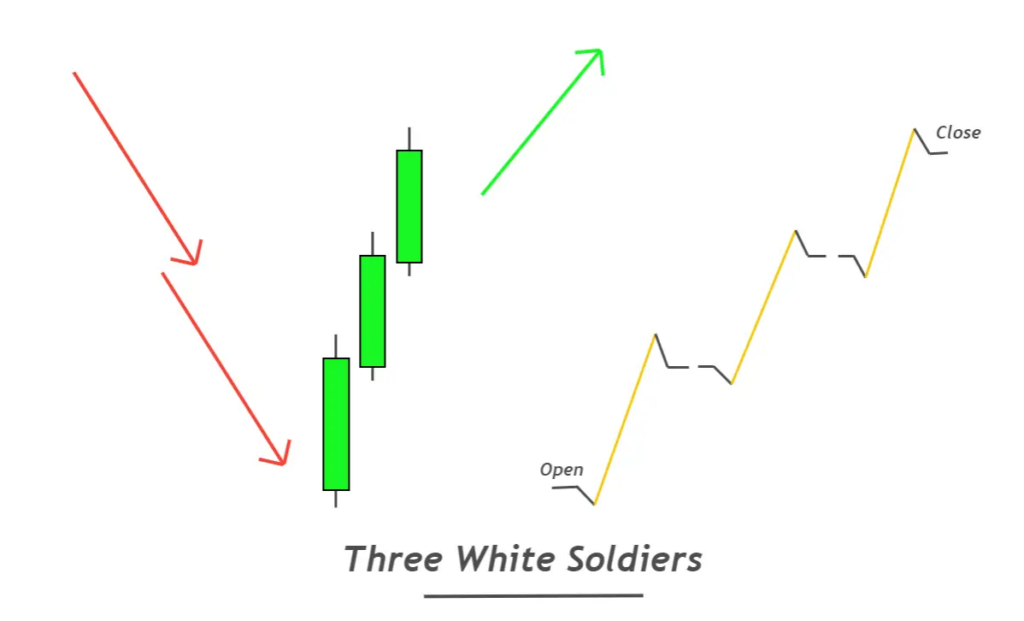
| Counter Pattern | Three White Soldiers |
What is the meaning of the three black crows pattern?
This candlestick is a confirmation that the bearish market trend has reversed.
Let’s read the price…
Price value will increase during the upward trend. In technical analysis, a series higher highs and lower lows will be formed in price swings.
Wave cycles are always present in the price movement. An uptrend is indicated by higher highs and lower lows. The market is stronger with buyers than sellers.
A series of lower lows or lower highs, on the other hand indicates a trend that is bearish.
When LLs appear after HHs then the price reverses. Three black crows also indicates a bearish trend on lower timeframes due to three consecutive bearish candles.
A candlestick pattern of Three black crows confirms that the trend is going down.
How do you trade three black crows?
My experience has taught me that a trade should not be entered based on the candlestick pattern due to a few limitations
- Low-risk reward ratio
- The take-profit level is not projected.
Three bearish candles can bring the market down to a great extent. This makes it hard to sell an asset that is already heavily discounted.
What is the best way to use candlestick patterns in trading?
This pattern can be used to generate high profits. That is the analysis of a higher timeframe.
Three black crows trade strategy
This strategy analyses a currency pair, or asset on a larger timeframe such as H4, Daily or Weekly. This candlestick pattern can be found on these higher timeframes by using the above conditions. Then trade in the direction three black crows.
ExampleJohn received a candlestick signal consisting of three black crows on a Daily Timeframe. This signal generated an idea that a bearish trend is developing on a higher Timeframe. He will then switch to the lower Timeframe, such as 15M and 30M. Then, he will use a trading system and only open sell trades when the trend is negative on a higher Timeframe.

Now, this trading strategy is more profitable and has a larger risk-reward factor.
The Bottom Line
The number of successful trades will increase with this strategy. Not all candlestick patterns can be used to enter trades. It would be helpful if these patterns were used to develop a profitable trade entry strategy.


Responses